After working closely with my group members (Sam Salazar, Brendan Matthys, and Ethan Conklin) and familiarizing ourselves with the resources used throughout the semester, our final project seemed less overwhelming than I had originally anticipated. Essentially, this project consisted of a collective form of all the “mini” projects and assignments that we had already done for The Humanities Now! class. We were just giving them a home when we uploaded them onto the WordPress site.
I had worked with the WordPress platform in a previous class last year and already knew some basics about operating and designing my own website. Though Brendan did most of the changes on the website, my fellow group members and I were assisting him in what we thought best suited our project. Brendan became the leader of this group very quickly and began delegating different tasks to each member and offered assistance when we needed it. This was very effective for the members of our group because it really pushed us to get the work done. I know that the members of my group and I are very proud with the way that our website has turned out. Additionally, I think that creating a website for the research that we did on the Bethlehem Memoirs was the best way to fully display our hard work from the semester.
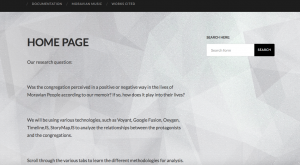
We wanted to make the central focus of our site our research question: “Was the congregation perceived in a positive or negative way in the lives of Moravian people according to our memoir? If so, how does it play  into their lives?” We did this by keeping the question centered on the home page so that our viewers could reference it at any point. Also, located on the home page is a simple explanation of the purpose of our site and the various technologies that we have used to answer this question.
After we transcribed every memoir, we uploaded them onto the “Oxygen” platform that Dr. Jakacki taught us how to use. From there, we were able to tag people’s names, place names, emotions, events, and health. After that, we extracted the entities that were important in answering our research question. We chose to compare emotions to place names to analyze how the Moravian people viewed their congregations. The entities were uploaded onto a “Google Fusion” table which you can view in the Tag Frequencies tab on the website.
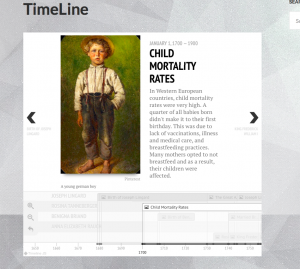
One of my favorite parts about this website is how interactive it is. The Timeline, Storymap.Js, and Voyant tabs provide information about our research while also requiring the viewer of the site to follow along and explore each platform. Because the Bethlehem Memoirs consisted of multiple people, our timeline project was very  unique. We had a stacked timeline that so that the viewer could see the events that occurred during this time period according to each person from the memoir. Grafton wrote about this in his introduction by saying “by comparing individual histories to one another and the uniform progress of the years, the reader could see the hand of providence at work”(Grafton, pg. 15).
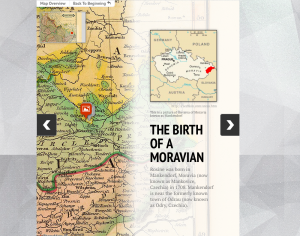
I think the most important tab located on our website would have to be the Storymap.js tab. You can explore a story map for any one of the four major memoirs that we transcribed. Because there were numerous people in the Bethlehem memoirs, each member from our group had focused on one  particular person from the memoir throughout the semester. On this tab, you can select one of those people and it will take you to their storymap. This was essential for our website because it displayed how far each person traveled by pinpointing places that they mentioned in their memoirs. This visualization of mapping that we used was principal to the project because it took every point and created a visual that allowed the viewer to analyze the distance that was travelled.Adding to that point, Drucker wrote, “…however we classify the visualization that we use, they all require the same analytic approach to expose the working of their graphical organization as meaning-producing” (Drucker, pg. 66). My memoir, Rosine Tanneberger, was kind of different from the others because her journey was short. She only traveled from her birth place of Mankendorf, Moravia to Gnadenfrei, Germany.
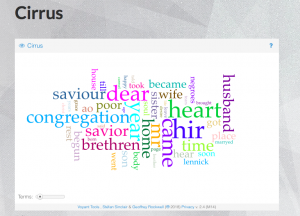
Lastly, we chose to use Voyant. This was the first platform that we explored for this class and we felt that it would be pretty necessary to include it in this project. Similarly to our entities, it extracts words from the memoirs and puts it into a distinct visualization, but using Voyant we were able to analyze it through all of our memoirs collectively. This platform is pretty cool to play around with because there are so many different options to create your own visualization of the words. We only included the a few that we felt  represented our memoir best. These included Cirrus, TermsBerry, Textual Arc, and Links. My favorite visualization comes from the Cirrus tool because it creates a clear depiction of the visualization that emphasizes the most frequently used words. The biggest words are used the most across all memoirs, while the smaller words are used less. “Heart”, “Dear”, and “Congregation” are just few of the many words, but they are seen as the largest words using this tool.
Overall, I think that my group members and I are very proud of the work that we have put into this project and website. The most important part of this whole project is that we got to explore the lives of Moravian people through analyzing their work. We had fun creating this website together and even added a special tab that includes Moravian Music which you can listen to while exploring the site. Even though there was a lot that was involved in creating this project, it made the semester fly by and I’m really going to miss working with Ethan, Brendan, and Sam as well as these memoirs. I hope you enjoy our website just as much as I do!
http://bethlehemhumn100.blogs.bucknell.edu
P.S. Thank you for a great semester!
Olivia Smith is a student at Bucknell University in Lewisburg, Pennsylvania. She was born and raised in Manasquan, New Jersey. She is currently apart of the Bucknell Women’s Rowing Team and plans to major in Psychology and Creative Writing.


