Categories
Blog #1

Blog #1 – Caleb Broughton

Often times when historians are analyzing an archive, specifically one that is large in size and may take a long time to analyze fully, they run into some trouble with a term that Micki Kaufman uses in her project Quantifying Kissinger; “information overload.” This over abundance of information usually requires multiple different tools and methods for analysis, and when historians are working on this for hours at a time, the work can become tedious, frustrating, and sometime unproductive. This leads to spending more time looking at a screen and figuring out how to use certain methods and tools, rather than focusing attention on the physical archive itself.

Creating a digital artifact from archival documents gives way to so many advantages. First of all, the majority of archival documents are in rough condition, and are very fragile to the touch. If digital artifacts were not a thing, most of what we know about history from these archival documents would be unknown. Some documents are illegible to the human eye but with technology, historians are able to recreate a lot of these archival documents.

Image result for archived documents digital humanities

I think it is true that our physical and emotional relationships to our objects of study are shifting as we move deeper into a digital age. I think they are getting stronger and more intelligent, because a lot of the content that is being created connects directly to our natural human instincts, and can be very beneficial for people. As Whitley says in his paper, “Humans are quite adept at perceptual visual cues and recognizing subtle shape differences…humans are pre-wired for understanding and visualizing shape.” Because of this natural ability that humans possess, these digital tools that transform textual patterns into visual shapes naturally help people grasp certain skills of shape perception. There is even speculation that because this portion of the mind is being activated by these digital tools, it could potentially be accelerating the reading process.Image result for textarc

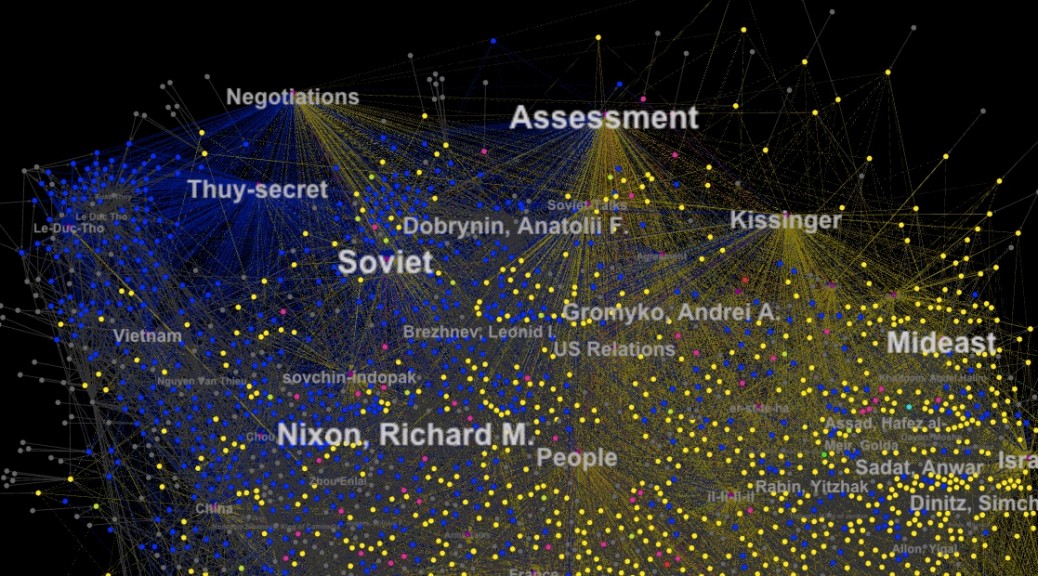
Whitley talks about creating these things called “concept shapes” out of texts,  to graphically represent data patterns. In order to better understand the content of a document, a group of scholars came up with a method for representing texts as “semi-spherical objects in a virtually rendered three dimensional space.” Wherever there are patterns in the text, the spherical objects “blend together to create a variety of quasi-organic shapes.” This method is one that seeks to help readers identify different patterns that would otherwise be overlooked if it was in a large body of text. For this, I believe it is true to say that digital versions of material texts highlight physical elements of texts that might otherwise pass unremarked.

One way to create online reading interfaces that can more closely approximate the experience of reading physical materials, that Whitley talks about in his paper is TextArc. It is an experiment in spatial reading, and is based off of the idea that seeing and reading are two complimentary processes. Whitley describes it basically as a “balancing act between reading and seeing.” As people are experiencing the text visualization, the eyes and the mind “scan for ideas, then follow the ideas down to where and how they appear in the text”.


Categories
Blog #1

Blog Post #1: “On Material and Digital Archives”

An advantage of creating a digital artifact from archival documents is that there is a much larger amount of data and information available for researchers and the general public. Artifacts and manuscripts that have been too frail for people to look at and use in the past are now accessible. We are now able to use the information, that we never had access to before, to help learn from the past and improve in the future. Researchers and other individuals can link information together and find patterns and trends that they would have never been able to have done before.

This old ship’s log can help us learn from the past, so that we can create a bright future.

However, one of the problems associated with creating digital artifacts is that the computational techniques usually used to store these digital archives cause limitations to those interested in seeing them. Also, the process itself of turning an artifact into a digital archive can be dangerous to the artifact. It is so old and so fragile that it can get damaged very easily. Another problem that I see with creating digital artifacts is the large margin for human error. Most of the times, people are the ones converting the archive to a digital medium and they could misread the writing or accidentally make a typo that makes the artifact inaccurate.

The side by side view of Jane Austen’s Fiction Manuscript in print and the digitized one created by an individual demonstrates the margin for human error and how difficult deciphering manuscripts can be.

I feel that digital archives do not supplant our need to view the physical originals, or enhance the necessity of and desire for archival work. I think that the easy accessibility that digital artifacts provides takes away the excitement for researchers. Though they can just easily look online for the one thing they are looking for instead of having to do research to find it. They will not get to experience the extreme happiness that they feel when they discover something which could eventually cause them to lose passion for their topic of interest. I believe that researchers learn the most when they are looking for information because they run into other data along the way and learn even more when they see the archive in context.

That being said, I feel that open-source and free digitized materials provide opportunities for students and other people looking for specific material to find things that they otherwise would not find. They are able to explore topics in a much deeper manner and discover things that they never even would have thought of. I think the use of these materials also help individuals discover something that interests them that they may have never known existed before looking at digital archives. Students are able to study groups of people that they never heard of and provide them with a much broader perspective on the world and the world’s history.

I believe that because of the creation of digital archives, our research practices have dramatically changed. Most information people need is on the computer and is accessible across the world, so there is no need for individuals to go to the library. Instead of working in groups and dividing up parts of research projects, people are more likely to work on their own and not collaborate with other individuals. I think the use of digital archives have taken the socialization element out of research. I believe that it is a shame because people learn the most from one another and are the most successful when they are working with others because they get different perspectives they would not have thought of otherwise.

Categories
Practice Blog

Visualization and Preservation

The primary focus of Adrian S. Wisnicki’s project, Livingstone’s 1871 Field Diary, is preservation. Due to not having the proper technology, David Livingstone’s field diary had remained unpublished and inaccessible. By using spectral imaging and processing technology, the project team was able to decipher what was written in the original diary. Preservation is one of the most important topics when dealing with digital humanities. If we are not able to preserve the old texts, then we will never be able to transcribe them, meaning we will never get to read them. Preservation does not come with just old diaries, such as in the case of David Livingstone, but also with historical maps and records.

The primary focus of the project, Selfiecity, is visualization. By obtaining selfies from thousands of people worldwide and compressing them into a collage, it becomes possible to analyze demographic patterns of selfies. It may seem unnecessary to study selfies of people, but interesting findings have come out of the project – one finding being happiness. Of the cities studied, Bangkok has the highest ‘smile rating’ with 68% of selfies being smiles whereas Moscow had a 53% smile rating. In a study of social media patterns, it was very smart for the Selfiecity group to use the visualization method. Currently, Snapchat and Instagram comprise a large portion of social media where both medias are about posting or taking pictures of yourself. It would be much harder for Selfiecity to explain their findings if they did not have photographic evidence to back up their findings.

Categories
Practice Blog

Practice 8/28 – Tyler George

My first digital humanities approach I chose to look at is mapping, by observing the Map of Early Modern London (https://mapoflondon.uvic.ca/agas.htm) page created by many members, who were lead by Janelle Jenstad, Martin Holmes, and Mark Kaethler. This map is designed to streamline the information found in encyclopedia, library, and stow editions all into one place with an easy user interface. Primarily this map is an example of textual analysis, by bringing hundreds of texts together to provide the viewer a streamlined overview of each particular area, while also providing the information to dig deeper into their research should they choose. The map is also an example of visualization, while also preserving and analyzing the areas of historical London. This is a great way to do this because maps provide a much more clear representation of what London actually looked like than you would ever find in a typical textbook. This interface allows us to visualize great amount of historical information in an accessible way. Easy to use, this map allows me to zoom in on a location, click on it and provides vast information on that location. Additionally, you can sort by category and pull up any locations relating to that category with ease. This map revolutionizes the way users view maps and find certain things in London. Not only does it show me the location of each place, it provides historical context as well as hundreds of articles about each place. This is easily the best interface for viewing a map, as it is easy to search for or find new places, and provides more information on each place than possible to find anywhere else. Lastly, this map is able to include where each piece of information came from, making it easy to verify the authenticity of their information.

.


Another interesting website I viewed is titled Selfie City (http://selfiecity.net/#) coordinated by Dr. Lev Manovich, by there help of several contributors. This site provides image plots trying to categorize the commonalities of selfies in particular areas. This is a clear example of visualization, define by Johanna Drucker as “a methodological reversal which makes visualization a procedure rather than a product and integrates interpretation into digitalization in a concrete way”  (Whitley reading). This site uses image analysis to relate themes between selfies, for example the tilt of photos, use of glasses, age, gender, etc. There is definitely no better way to find information regarding selfies by region than through their technology used that closely examines each image. One interesting stat found was that Sao Paulo females tilt there head on average 17 degrees in their selfies compared to Moscow males who average a 7 degree tilt. This is a very interesting stat that I would never have previously thought possible without the use of this technology. Their automated analysis of images allowed them to recognize just the smallest details that would’ve taken forever to browse through so many photos with just the human eye. When examining photos, this is truly a remarkable discovery that will revolutionize the way we study images.