The method utilized to represent historical data is just as important as the the information it contains. Modes of representation can determine the clarity of the information being shared and are examples of interesting ways to analyze information. Chronology and Geography, two modes brought up by Grafton, show us the pros and cons of using certain modes of representation to present historical data/events.

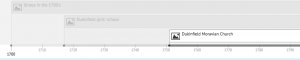
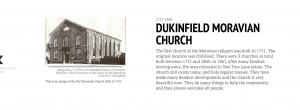
During the creation of the Timeline.js project and reading of Grafton’s work, I got to experience and learn how information and the mode of how it is represented have a close and dependent relationship. In Cartographies of Time, Grafton shows how modes of representation have progressed throughout history, highlighting the improvements and background that led to timelines. Historical data can benefit or suffer from its compilation into a timeline or its representation on a map. I definitely witnessed the benefit of each mode on the events that I pulled from my transcriptions. All timelines, the medium of chronology represented in this project, are unique and have different forms of organization. My timeline utilized contextual events in relation to the historical events in my transcription and then presented a visual in order to better support each event. The main benefit of this method is its organizational value that creates a better understanding of the historical events, both literally and contextually, for the reader. This method also makes the presentation of the data more interesting with its visuals and contextual events. Another interesting aspect of this timeline is how it has the capability of utilizing maps, a popular medium of geography, in its visuals. The main con of utilizing chronology to present historical data that I saw in this project is that the “story” can become compromised in the process of collecting the data to compile into a timeline. For instance, when scouring the transcriptions, we automatically pull the events that come with a date; in order to chronologically organize data, we feel the need for numbers. Because of our reliance upon the time, days, months, and/or years that structure the line, we sometimes fail to dive deeper into the events represented, sacrificing the “story.” Grafton points this out in his work, stating, “Our idea of time is so wrapped up in the metaphor of the line that taking them apart seem virtually impossible.” In this process, many key events in the transcription are not pulled simply because they were not attached to a specific time, day, month, or year and, in turn, are not represented and shown to the reader. Even if these events are included and compiled into the timeline, there is a compromise in accuracy; the author must then generalize the time in which the event took place. With geographical representation, events and data can also be compromised. Similarly to how events without time, day, month, or year cannot be included in timelines without being compromised, events not marked by a location cannot be geographically represented without being compromised.
After the completion of my timeline, I came to the conclusion that the modes of representation identified by Grafton are very beneficial when used to present certain data. In addition, I noticed how these modes of representation can be detrimental when used to present other data. My findings evoke the debate of whether or not the purpose of these modes is to tell a story or simply organize data. In my opinion, they do both. These modes organize the data/events in a way that we can formulate a story. As Grafton points out in his work, the author must first look past the linear when creating the timeline, and the reader must do the same if we are to utilize all of the benefits that come with timelines. The lines of a timeline are the lives of the story; when they end, the story ends. And the visualization of the locations of the events provided by the use of geography as a mode can make sense of the data and further support the story.
LINK TO TIMELINE: https://docs.google.com/spreadsheets/d/19D5MbZfE71t0zlKwUYbnZyNQD3EcQef-JETzGkvr17k/edit?usp=sharing


Ethan Conklin is from a suburb outside Pittsburgh, Pennsylvania. He is currently pursuing a B.A. in Spanish and Anthropology at Bucknell University. Ethan hopes to attend law school after finishing his undergraduate studies and is excited to see what the future holds.