Categories
final blog

Final Blog Post

Given the implications in the name of the course itself, “Humanities 100”, it was only inevitable that this class had a consistent theme of analyzing the effects of digital humanities on society. It does not take a rocket scientist to figure out how drastically technology has changed the very world we live in today. For example, imagine the typical tourist wandering around the Big Apple. After maneuvering through the hordes of people glued to their cellphones, this tourist looks up and see the endless flashing monitors of Times Square. Finally, after a full day of festivities, this tourist finds his/her way back to their grandparents’ apartment who then proceed to complain how none of these fancy gadgets or screens even existed back in their generation. Needless to say, the world has experienced a technological explosion. The question is where did this sudden incorporation of technology derive from, and what are the consequences? A larger contributor is the creation of personal computing in the 1980s, which influenced people to view the world from a new lens. Society became quickly reliant on the internet with audio, visual, and graphical capabilities. Thus with due time, the field of digital humanities was created. The digital humanities are changing a world in which knowledge was taught through texts and stationary pictures and progressing to a world that produces and organizes knowledge through graphic designs and more. However, what is the advantage of implementing these graphics and visualizations towards internalizing text compared to traditional literature?

In his article “Visualizing the Archive”, Edward Whitley reflects upon how the human brain processes information. “Humans are quite adept at perceptual visual cues and recognizing subtle shape differences. In fact, it has been shown that humans can distinguish shape during the pre-attentive psychophysical process” (Whitley, 193). This fact entails that human brains are pre-wired to process and visualize shapes. The digital humanities provide the capability to turn complex bodies of text into software that can process this information into an extensive amount of graphs and even identify patterns. Nonetheless, it’s necessary to point out that not one single method of representing data is superior in every aspect. There are still benefits to reverting to the use of standard reading. For example, it’s intuitive that closely reading the actual text is going to provide the most accurate summary of the text and its details. However, it’s when texts become too long that the amount of information any individual can process begins to plateau. Whitley refers to this phenomenon in his article as the bottleneck effect. Only so many details can be remembered before the brain loses concentration and reaches its limits. For this very reason, digital humanities are advantageous in the the sense that complex texts can be simplified to be processed to the natural tendencies of the brain.

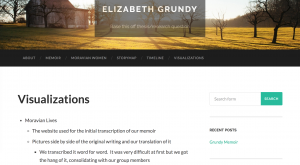
To provide some context on the capabilities of digital visualization tools, let’s focus on my favorite platform: Voyant tools. Originally, my group’s assignment was to review a 40-page digital archive of text written by Esther Latrobe and then decipher the text back into modern day English. This memoir had enough length to where the bottleneck effect started to kick in. Especially cause this document was written in a style of cursive and writing style that was unfamiliar. At first, we read the text document in it’s entirely like any other story one would read. We were provided numerous details on the several hardships that Latrobe endured. However, when we inputted the text of the memoir into Voyant Tools, the overlying themes became clearly apparent.

The picture above colorfully depicts the most frequent terms of the Latrobe’s memoir. It was now clear how strong a role religion played in her life because some of the most frequent terms included “god”, “lord”, and “saviour”. As Whitley would agree, Voyant Tools adhered to our brains’ tendency to register shapes and patterns. We now understood just how much religion really meant to Latrobe. It was this realization that shaped the research question of our final project.

Our research question was: How did Esther Latrobe’s relationship with God affect her lifestyle, and help her recover from such illnesses and hardships? Tragically, she was exposed to many harsh realities. For example, her mother died when she was only 11 years old. Additionally, she suffered from two diseases that nearly killed her both times. Keep in mind that the 1800s lacked the medical technologies that are available to the present world. Therefore, many diseases were lethal. To give light to how lethal diseases were from this time period, consider the Cholera Pandemic of 1817-1824.

This outbreak occurred during Latrobe’s life, which took the lives of over 400,000. The screenshot above is a picture from our timeline on our website. It was a miracle that Latrobe was able to survive not one, but two severe illnesses. In fact, her physician made several comments regarding how she had a shockingly high pain tolerance. Our group concluded that it was most likely her drive to maintain a close relationship with her “Saviour” that enabled her to become resilient, even against all odds. Another effect of her devotion to religion was its influences for her to travel, which was no cheap affair. To give a specific example, when she married James Latrobe, she had to move to Ayr Scotland because James had been called to service at the congregation there. “We are inherently spatial beings: we live in a physical world and routinely use spatial concepts of distance and direction to navigate our way through it (Bodenhamer, p. 14). As Bodenhamer believes, space is more than just for historical action. Space is a significant product and determinant of change. It was through this constant traveling that shaped the rich character that Latrobe developed.

However, as our group mentioned in our timeline, she lived a short life of only 28 years, and she died to Ayr Scottland soon after her marriage and giving birth.

Post URL: https://latrobehumn100.blogs.bucknell.edu/wp-admin/customize.php


Categories
final blog Uncategorized

The Final Blog Post

To begin, this was a long and interesting journey in making the Esther Latrobe memoir into many things like the transcription, the timeline, a story map and etc. All of these things that the class did was pretty unique and once in a lifetime experience. However, there were some difficulties in making this all happen. An example can be on the first time the whole class started doing transcriptions on the memoir they all received, and how most of our pages were so blurry that no know could transcribe it. Luckily we had a person named Lorraine Parsons who is a Librarian and Archivist at Church House at the London Headquarters of the Moravian Church in the British Province. She was able to get high quality pictures of Esther Latrobe memoir in a matter of days, which were really clear to see.  

To begin, in doing our website, my group wanted something appeal to the eye when visiting the site itself. In order to that we had to come has a group to see what fits to our style and to theme of our memoir. We played around with the website for a bit and tried to see how everything worked for all us, but in choosing our theme to our website in the first day of this assignment the website did not work properly at all. Luckily we had the help Carrie every time we needed help with technology. Once the website problem was finally fixed (which was to get a new theme for the website) we had game plan in what had to do for it. Each member of our team was dedicated to a specific part of the website. One of the task was to included a summary so people could get some background information on Esther’s life and to add our research question and conclusions so people who visited our site would be able understand what our main objective was throughout the whole semester. Each member of my team did amazing in their part in making the website beautiful for many people to see for the future. Also,  having the the opinions from other people that are not from our group were essential to have because even as a group we can make mistakes as a whole in our website and one doesn’t realize that there is one.

These were all the artifacts that my group used in analyzing the memoir: Transcription Desk, Oxygen XML Editor 20.1, Voyant, Timeline, Story Map, Digital Edition, Website. With using Oxygen especially, the process of marking up the transcription that my group made affected our understanding of the text in many levels into understanding it how one would analyze the text. Because there are many things to consider in the sense in what we had categorize as what. For example “God” or “Lord,” these words can have different meanings to it because many people have different opinions on this subject. Is “God or Lord” a human being, is it a thing or is it an idea for many people. There are so many ideas that one has to contemplate to mark it.

Overall, The process of collaborating as an editorial board with my group also changed our understanding of how edited texts are produced. When collaborating with my group one had to keep in mind in we needed to do as a whole. “Decisions about what one should encode and should not encode are to be determined according the purpose of our encoding.” (Pierazzo 469)

As I explained in another blog post, in the memoir that my group worked one there were not many dates on the life of Esther Latrobe. In doing her story map and the timeline of Esther Latrobe it was mostly about the sicknesses she faced during her life, how she always prayed for god for forgiveness and etc. This relates back to our research question which was, “How did Esther Latrobe’s relationship with God affect her lifestyle, and help her recover from such illnesses and hardships?” The reason we choose this as our question is that as a group we noticed that Esther was very devoted to her religion and she unfortunately spent most of her short life ill.

Also, there was a comment from one of my group members that got us thinking how the traveling information is not represented in the timeline or in the memoir. It does tells us where she goes, but it does explain how long it took to get there, the method she got there and her experiences she had to face when journeying to a place. Latrobe journey consisted of her being born in Bristol, England in 1802 then moving Tytherton, England in 1820. Later on moving to Gracehill, Ireland to become a teacher and finally settling in Ayr, Scotland where she died in peace.  This journey she had must have been a long one for her because in the age of existence she did not the luxury that many humans have now in getting to one place to another.

Furthermore, this whole timeline lets us perceive the journey one takes in ones own life. However, this timeline has its own limits in how one can convey the journey of someones life with limited amount of information that was given in our memoir for Esther Latrobe. “Each artifact (memoir, timeline and etc)  would constitute a separate record anchored in time and space, thus allowing us to keep them in a relationship, and each layer would contain the unique view overtime of an individual or a social unit.” (Bodenhamer 27)  With that in mind one can never know exactly how things truly happen to a specific person like Esther Latrobe. One can never know if she actually took a regular boat to go Ireland or Scotland, she might have swam all the way there or gone with pirates because this was an era of pirates.

In the end, one can learn a lot from other people especially from one’s own team, from other teams, from professors  and even Esther Latrobe. Even though she had a short lived life, she kept persevered to live on everyday with the intent of helping others and loving those around her. I am glad to have read her story because it made me relearn about life again.

http://latrobehumn100.blogs.bucknell.edu/digital-edition-2/

Categories
final blog

Final Blog

After finalizing our transcriptions and analyzing them, we were able to create a website using WordPress. WordPress allows us to choose a theme for our specific website. We can then add different tabs for each part of our project. The different sections of our project consist of: about, memoir, Moravian women, storymap, timeline, and visualizations. In the about tab, each one of the authors added a short biography of themselves.

A short summary of Elizabeth Grundy’s memoir was provided in the tab labeled memoir. The next tab, Moravian Women, provides viewers with an analysis of Professor Faull’s book, Moravian Women’s Memoirs. In this book, many of the women speak of the struggle they encountered when choosing between family and religion. One of our group members analyzed the difference between single women and married women in regards to which they prioritize, family or faith. After researching the topic, we were able to find answers to support our research question, were there different relationships between allegiance to family and allegiance to the church in Moravian Lives? It was determined that single women tended to devote their entire life to religion whereas married women were able to find a balance between the two. Those who did not have a significant other had their life revolve around their Savior after joining the Congregation. For the married woman that was researched, her husband was a part of the Brethren Society. With this, he family life and religious life overlapped a bit; it was easier for her to focus on faith at some times in her life and family at others. This showed that there were, in fact, definitely differences in relationships between allegiance to family and allegiance to the church in Moravian Lives. From our research, it showed that it tended to depend on one’s marital status, and if they were married, who they were married to.

Storymap JS was used to map out different places in Elizabeth Grundy’s life and connect these places to each other. We were able to see where the important events in her life occurred and find relationships between them. We could determine where her important religious events took place as well as her familial events and see if they occurred in the same places or ones that were close to another. We were able to see if she had to drop everything to travel far for something else or if things were connected.

There were several different visualization techniques used when analyzing our transcription and determining the answer to our research question. “A digital edition can represent many more features than a print publication can,” (Pierazzo 472). Pierazzo speaks of the many benefits of using a digital edition over a print one. The visualizations tab on our website contains many subsections: Moravian Lives, Oxygen, TEI File, WordPress, Voyant, and Google Fusion.  Moravian Lives was the tool we used when first transcribing our memoir and gave us our first glimpse into the amount of times she spoke of her family and the amount of times she spoke of religion. It was very easy to realize, after reading through the memoir once, that these two things were incredibly important in her life, and her entire life revolved around them both.

Oxygen allowed us to create tags on specific words that we felt were important in analyzing the memoir. Our markups were recorded in a TEI file. This allowed us to see the amount of times she spoke of her family, i.e. son and husband, as well as religious figures, i.e. Lord and Savior. We could also see the different places she traveled as we tagged place names as well as important events. Through the tags, we had the ability to see which tags were near each other to determine if there were relationships among her two allegiances.

There is a subsection called WordPress that explains the usage of the tool in organizing our final project. We were able to use WordPress to put all of our research and information in one spot to help viewers in understanding our research question.

The Voyant tool gave us multiple ways to find determine relationships in her memoir. The specific tools we used were StreamGraph, Trends, and Word Tree. When thinking of our research question, StreamGraph and Trends provided us with the frequencies of key terms used throughout Elizabeth Grundys’s memoir. We were able to gain an idea of how often she spoke of her family and how often she spoke of her faith, determining which was more important to her at which part of her life. Word Tree graphed connections between key words and their surrounding terms throughout the memoir. We were given the ability to see if there was ever an overlap between religion and family. “With the tools that are now available, such as Voyant 2.0, Antconc, Jigsaw, Gephi, it is possible to extract textual digital data (plain text files) from transcriptions and/or translations and quantify and visualize verbal patterns,” (Faull 18). These tools give us the ability to analyze texts in different ways.

Google Fusion provides users with an analysis between two specific tags. We could see connections between key words and ones that surround them through graphs.

Menus are embedded in the website to aid in the navigation. Users can access information through many different ways. Users can also search key terms in order to find information on them.

With all of these tools, it helped us answer our research question that there are different relationships between allegiance to family and allegiance to the church. In Elizabeth Grundy’s case, she was able to find a balance between the two. Her son was heavily involved in the religious community which made it easy for her to prioritize both, often at the same time. Even when she ad a husband, she still kept religion as a priority. She moved to some areas for religious reasons and other areas for familial reasons. As she was dying, the most vulnerable point in her life, she had her son next to her while she spoke of religion. This exemplified the importance of these two things in her life.

Our group did not encounter many difficulties throughout the entire project and even when creating the website. Our main issue occurred when trying to incorporate menus into our site. They were difficult to figure out at first, but we were soon able to complete it. Choosing a website design and adding pages was easy to do.

I really enjoyed this class. It was something totally different from my major. It was nice to branch out and study new things. I found it very interesting.


http://grundyhumn100.blogs.bucknell.edu/