While transcribing my assigned memoir, I paid close attention to every individual word, rather than looking at the document as a whole. However, after my transcription was complete, I was able to read over the document and really pay attention to the actual story of Joesph Lingard’s life. My memoir is mainly about Joesph Lingard and his family and how he found his way into the congregation. The memoir discusses how Joesph and his wife were extremely unhappy and joined the congregation to rid themselves of this unhappiness. At first, Joesph and his family did not have a home near the congregation, so the brethren actually offered his family a place to stay until they found something more permanent. The memoir continues on following Joesph through all steps of his journey into joining the congregation. In the end, Joesph falls ill. As we move forward, I am excited to look more into not only Joesph but his family members, specifically his son, because they were so important in the memoir.\
Edward Whitley writes, “the virtue of information visualization is that it can make complex data sets more accessible than they otherwise might be” (188). Whitely is correct in that information visualization tools, such as Voyant, make complex text, like the Moravian memoirs, much more digestible than they might seem at first. Our group research question is: Was the congregation perceived in a positive or negative way in the lives of Moravian People? This approach has been somewhat helpful in answering our research question, but it certainly doesn’t offer a complete answer. This approach has been helpful in getting a better sense of how the Moravian people viewed the congregation because we have been able to pinpoint where the word congregation has been used and the words surrounding it, as I talk about below.
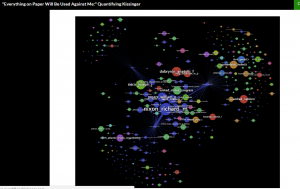
Using Voyant has allowed me to interact with my assigned memoirs in a new way. TextualArc allowed me to see the flow of 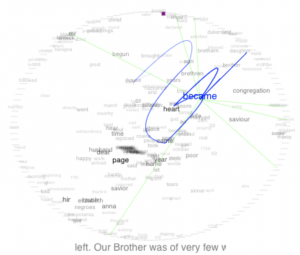 keywords throughout my document in a neat visual. This tool painted out a nice overview of the text, and “creat[ed] visual abstractions of textual patterns” (193), which I used before diving into other tools that gave more detailed data. In a way, I used this tool to see a summary of my document. In my opinion, the most helpful tools on Voyant are those that allow you to see the frequency of different words in the text. Both the Cirrus word cloud and Document Terms allowed to see the frequently used terms in two very different, but equally helpful, ways. First, the
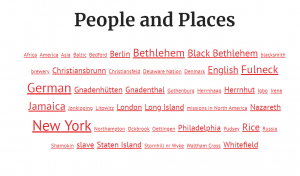
 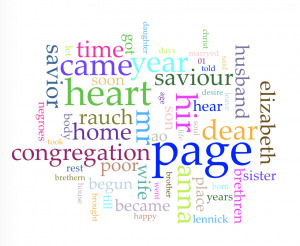 word cloud emphasizes a frequently used to term by making it larger. Observing my word cloud, I was able to see that congregation, heart, saviour, son, and brethren were most frequently used. I did not find any collocates to be particularly useful because no words were associated with another more than once, so no phrases presented themselves as frequently used in the document. These words allowed me to see that Joesph Lingard’s story of how he joined congregation was more instrumental to the text than I originally thought. However, the Document Terms gives the quantitative data to see how many times each of those words were actually used in the specific document, but not the whole corpus. For
 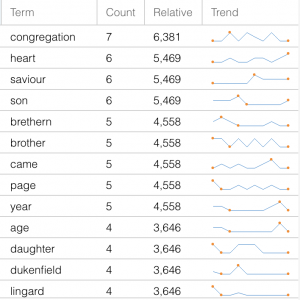 example, Document Terms showed that heart was used 18 times throughout the text and showed a trend line. This trend line is an especially helpful visualization tool in that is shows me where in the text the word is used most frequently, which allows me to ask more questions about that particular section of the document. For example, where the word heart is most frequently used, Joesph was speaking about his journey to join the congregation and how the brethren offered him lodging. Joseph’s frequent usage of “heart” shows that these kind actions deeply affected him. Overall, These tools are helpful because “amid the chaos of more frequent repetitions,” the tools allow me to see patterns that I “may have missed with close reading” (191).
Samantha is currently a sophomore Markets, Innovation, and Design major in the Freeman College of Management at Bucknell University in Lewisburg, Pennsylvania. At Bucknell, Samantha works as a Student Development Officer for the Student Calling Program and is a member of Alpha Lambda Delta Honor Society, Women in Finance, and is treasurer for the Chi Mu Chapter of Chi Omega Sorority. She graduated from the Morristown-Beard School in Morristown, New Jersey in June 2017. Samantha resides in Harding, New Jersey and during the summer, Samantha works at Basking Ridge Country Club.