I am glad I had the unique opportunity to create this final digital artifact. With each digital artifact we have completed this semester, I feel that I have continued to learn more about Tippet. Each time we complete another artifact my knowledge of the memoir is deepened. However, I can finally say that after completing this final digital artifact, I believe I have full understanding of Samuel Tippet’s memoir. In our final artifact, we posed the research question, “How did religion give Samuel Tippett and others during this time a new life”? It was a very gratifying experience compiling all of our work, and through this, answering the research question. It is interesting to reflect on the process that got us to this final step.
It was so special transcribing Samuel Tippet’s memoir. I felt as though I was privy to someone’s private journal. I found Tippet’s memoir to be very challenging to read originally. There were many grammer and mechanical mistakes in addition to blurry and unclear spelling. This made the transcription very difficult to complete. While it was challenging, I found that working on it with my group was very helpful. We often aided each other in clarifying spelling and grammar. It was useful to have group members to reflect with and bounce questions off of. Once we completed the transcription, we were able to begin analyzing it through several tools.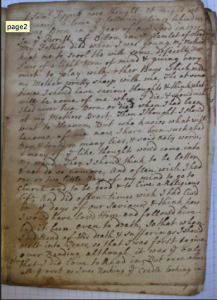
An extremely helpful analytical tool to us was extracting data. Through the process of extracting data, we discovered many key elements of our text. “By taking advantage of the visualization tools that scholars and professionals in the fields of computer science, graphic design, and information architecture have developed in recent years, those of us who work with digital archives will have the opportunity not only to enhance our vision but also to rethink some of our basic assumptions about how to read,” (186, Whitley). The process of tagging our text allowed us to come to realizations about Samuel Tippet’s life. We tagged words such as emotion, person and place. This pointed out to us the places he went, the people he encountered, and the emotions he felt. We realized that he was a very sad and negative person with many adversities in life. It became clear to us that he was very heavily reliant on religion. He often turned to God to get him through difficult times. Marking up the text deepened my understanding of it due to rereading it frequently. Through this process, my understanding of how edited texts are produced changed. I did not realize the sheer amount of work that editors put in until I experienced it myself.
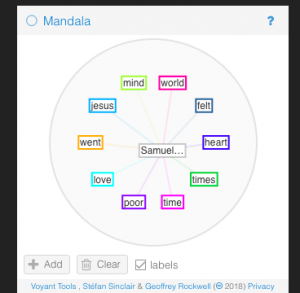
Another tool we used to help us analyze Tippet’s memoir was the visualization tool Voyant. “Specifically, I look at digital text visualization tools, such as tools that display word patterns in a graphical format and tools that rearrange the words of a text into playful and thought provoking images. These visualization technologies not only have the potential to transform how we currently use digital literary archives, but they also challenge us to read texts differently than we otherwise would,” (186, Whitley). Voyant truly broke down the text for us and allowed us to read deeper into Samuel Tippet’s memoir. It organized and displayed the information in a very palatable way through a variety of diagrams. Through using Voyant, we became aware of helpful facts such as word frequency and the exact count of how many times words were stated. This illuminated the high amount of religious and emotional content of Tippet’s memoir to us. Facts like these we might not have otherwise picked up on had they not been highlighted for us by Voyant. “We are inherently spatial beings: we live in a physical world and routinely use spatial concepts of distance and direction to navigate our way through it,” (14, Bodenhamer). Voyant offered us an opportunity to view the text in a different light.
Creating our timelines was similarly very useful for understanding the memoir. They gave us the ability to view Tippet’s life in a concise and chronological way. It broke down the material for us. Through adding photographs and dates, we were able to better visualize many aspects as well. Seeing Tippet’s life in a timeline really exemplified that his life revolved around religion. After we completed our timelines, we deepened our knowledge of the memoir by utilizing StoryMap JS. As Grafton explains, “while historical texts have long been subject to critical analysis, the formal and historical problems posed by graphic representations of time have been largely ignored. This is no small matter: graphic representation is among our most important tools for organizing information,” (10). Using StoryMap JS was personally the point where I felt I had a full understanding of the memoir. StoryMap JS tied everything together for me and brought the facts to life. Adding media and actually seeing the places Tippet references on a map was very clarifying for me. Once I finished this, I felt confident to create the final digital artifact.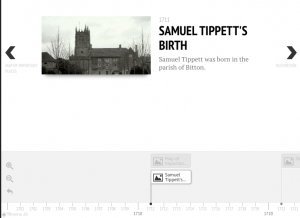
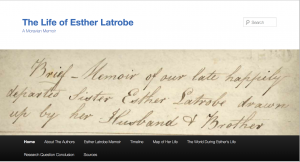
Finally creating the final digital artifact was a challenging yet satisfying process. Creating our page was an enjoyable experience because it is the culmination of a semester’s worth of work. Seeing our work as a group finally come together was very special. As a group, we firstly spent some time thinking about the aesthetic of our page. We decided to put a map of the places Tippet visited on our home page. We broke down our work under four different tabs. One we listed as visualization, one as digital edition, one as sources and another as about the author. We all collaborated on this project, however, my major contribution was developing all of the visualization tools. Our group dynamic was great and each member brought something special to the table. We met several times out of class and really put our best work into the final digital artifact. I feel that our final project has been a success. I believe that we thoroughly answered our research question of ‘How did religion give Samuel Tippett and others during this time a new life’ by the end of our project.
Allison Butler is a sophomore at Bucknell University. She is from New York. She likes fashion and tennis.
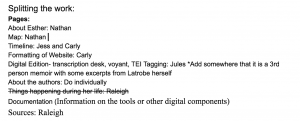
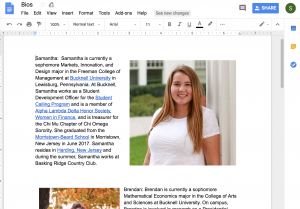 the site, Ethan, Olivia, and I still had a strong hand in the creation of the site. Specifically, Brendan led the group in delegating the parts of the website each person was responsible for. Each person would then gather the information from past modules or create the information that was necessary for the section. For example, each person was responsible for writing their own personal bios and to provide a picture, which we all put into a Google Doc to make it easy for Brendan to then copy onto the site.
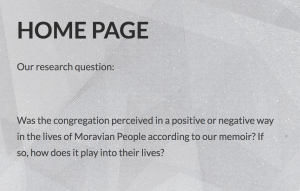 congregation perceived in a positive or negative way in the lives of Moravian People according to our memoir? If so, how does it play into their lives?” first because we then move to analyze and answer the question with various tools.
 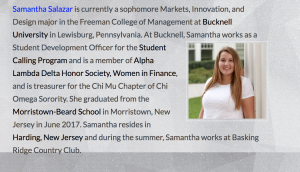 something a certain way. This speaks to Bodenhamer’s point that, “all perspectives are particular and dependent upon experiences unique to an individual, a community, or a period of time” (Bodenhamer,14). Next, The List of Memoirs allows the viewers to see whose memoirs we are analyzing by providing a list of names of our Moravians.
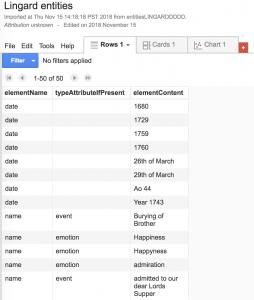 Our next section of the site is Tag Frequencies, which links to our Google Fusion Tables. This section allows the viewer to explore the entities of each of our Moravians which were extracted in prior modules. Specifically, if you were to click on Joseph Lingard, you are able to view a chart that shows what I had tagged in Oxygen. These tags included dates, person names, and even health updates.
 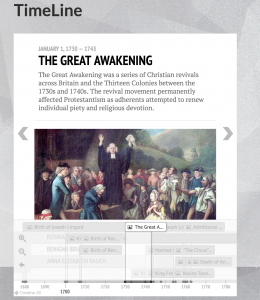 particular section is cool because it allows the viewers of our site to examine how our Moravians may have overlapped in both time and space. This is shown because our group was able to create a stacked timeline, which allows for our Moravian’s timeline to be viewed as a whole. The timeline section allows our Moravian’s lives to be viewed as a unique story or as Grafton puts it, “ [timelines] translate wonderfully from weighty analytic history books to thrilling narrative ones” (Grafton, 10).
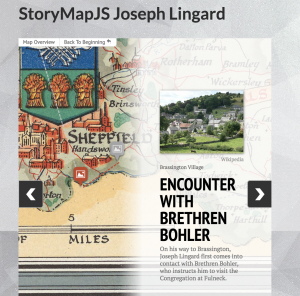 and the viewer is able to click on a name and be brought to their story map. The story maps allow the viewer to see how the Moravians traversed time and space on handpicked maps. For example, for Joseph Lingard, the viewer is able to see the massive distances Joseph traveled in the name of religion, illustrating the immense importance the congregation had in his life. Although the timelines showed how our Moravian’s stories overlapped, the storymaps illustrate that they were unique people and help to portray their individual journeys.
 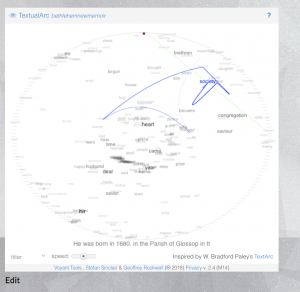 using the visualization tools in Voyant and including them in our site, our viewers are able to better understand our memoirs without actually needing to read through. This speaks to Whitley’s point that, “The virtue of information visualization is that it can make complex data sets more accessible than they otherwise might be” (Whitley, 188).
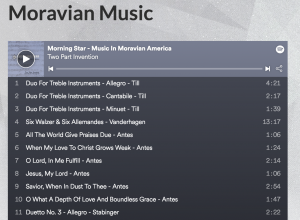 the playlists available on Spotify, to which we surprisingly found a playlist called “Moravian Music”. This section allows the viewers of the site the unique chance to better understand the Moravians and walk in their shoes. Lastly, our Works Cited section allows for our viewers to recognize the all the sources we used in creating our site.
 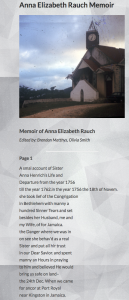 t our individual memoirs from text into an HTML format, which means that it is viewable on the website. I also found a picture of a Moravian settlement and HTML coded it in to precede each memoir, as if to establish an initial setting.
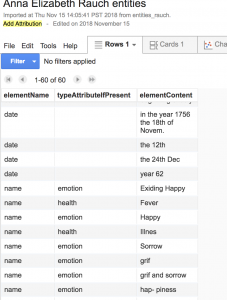 creating a network between the different tags, and creating a map of memoir locations.
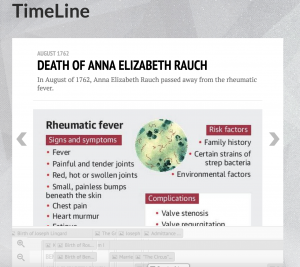 timeline contextually correct, as there is not much setting given within the memoir. The first website I used was a project by a volunteer curator named Margaret. She wrote about the Mesopotamia Plantation in Westmoreland, Jamaica, and how the Barham family ruled oppressively over the plantation.
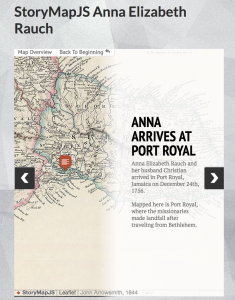 memoir was essential to answering the research question in that the lengths the protagonists went to fulfill their Moravian duties conveys their undying commitment to the congregation. I didn’t quite have the full story on Anna Elizabeth Rauch coming into this, but Professor Faull supplied me with the only book I could find on Mesopotamia, “A Tale of Two Plantations.” This book actually mentioned Rauch specifically, as well as her goals and ambitions in Jamaica. I was able to put this on our website because each StoryMapJS had an embed code that used iFrame, which is compatible with WordPress.
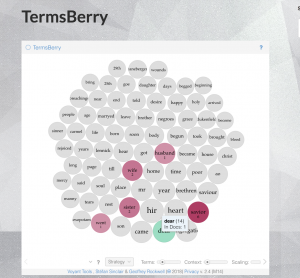
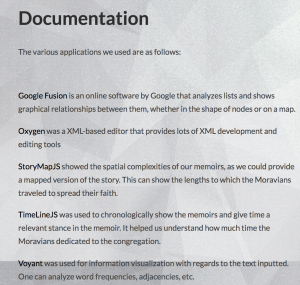 project. This page was important to include so it would be possible to replicate our exact methodology of analysis on another set of memoirs.
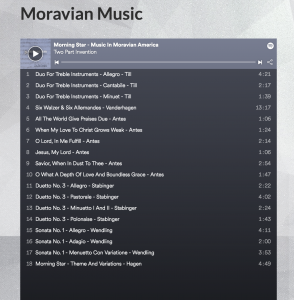 lives of the Moravians, and I found it to be pretty relevant to our subject matter.