Categories
final blog

Olivia Smith- Final Project

After working closely with my group members (Sam Salazar, Brendan Matthys, and Ethan Conklin) and familiarizing ourselves with the resources used throughout the semester, our final project seemed less overwhelming than I had originally anticipated. Essentially, this project consisted of a collective form of all the “mini” projects and assignments that we had already done for The Humanities Now! class. We were just giving them a home when we uploaded them onto the WordPress site.

I had worked with the WordPress platform in a previous class last year and already knew some basics about operating and designing my own website. Though Brendan did most of the changes on the website, my fellow group members and I were assisting him in what we thought best suited our project. Brendan became the leader of this group very quickly and began delegating different tasks to each member and offered assistance when we needed it. This was very effective for the members of our group because it really pushed us to get the work done. I know that the members of my group and I are very proud with the way that our website has turned out. Additionally, I think that creating a website for the research that we did on the Bethlehem Memoirs was the best way to fully display our hard work from the semester.

We wanted to make the central focus of our site our research question: “Was the congregation perceived in a positive or negative way in the lives of Moravian people according to our memoir? If so, how does it play 
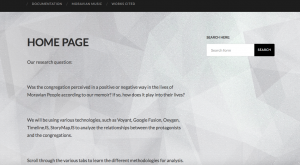
into their lives?” We did this by keeping the question centered on the home page so that our viewers could reference it at any point. Also, located on the home page is a simple explanation of the purpose of our site and the various technologies that we have used to answer this question.

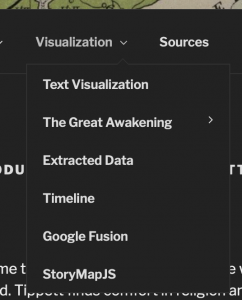
After we transcribed every memoir, we uploaded them onto the “Oxygen” platform that Dr. Jakacki taught us how to use. From there, we were able to tag people’s names, place names, emotions, events, and health. After that, we extracted the entities that were important in answering our research question. We chose to compare emotions to place names to analyze how the Moravian people viewed their congregations. The entities were uploaded onto a “Google Fusion” table which you can view in the Tag Frequencies tab on the website.

One of my favorite parts about this website is how interactive it is. The Timeline, Storymap.Js, and Voyant tabs provide information about our research while also requiring the viewer of the site to follow along and explore each platform. Because the Bethlehem Memoirs consisted of multiple people, our timeline project was very 
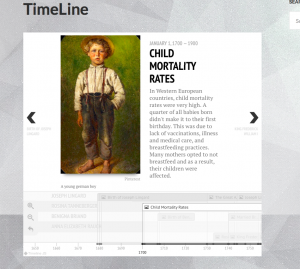
unique. We had a stacked timeline that so that the viewer could see the events that occurred during this time period according to each person from the memoir. Grafton wrote about this in his introduction by saying “by comparing individual histories to one another and the uniform progress of the years, the reader could see the hand of providence at work”(Grafton, pg. 15).

I think the most important tab located on our website would have to be the Storymap.js tab. You can explore a story map for any one of the four major memoirs that we transcribed. Because there were numerous people in the Bethlehem memoirs, each member from our group had focused on one 
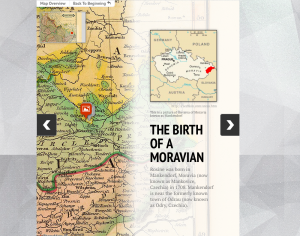
particular person from the memoir throughout the semester. On this tab, you can select one of those people and it will take you to their storymap. This was essential for our website because it displayed how far each person traveled by pinpointing places that they mentioned in their memoirs. This visualization of mapping that we used was principal to the project because it took every point and created a visual that allowed the viewer to analyze the distance that was travelled.Adding to that point, Drucker wrote, “…however we classify the visualization that we use, they all require the same analytic approach to expose the working of their graphical organization as meaning-producing” (Drucker, pg. 66). My memoir, Rosine Tanneberger, was kind of different from the others because her journey was short. She only traveled from her birth place of Mankendorf, Moravia to Gnadenfrei, Germany.

Lastly, we chose to use Voyant. This was the first platform that we explored for this class and we felt that it would be pretty necessary to include it in this project. Similarly to our entities, it extracts words from the memoirs and puts it into a distinct visualization, but using Voyant we were able to analyze it through all of our memoirs collectively. This platform is pretty cool to play around with because there are so many different options to create your own visualization of the words. We only included the a few that we felt 
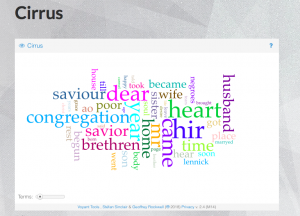
represented our memoir best. These included Cirrus, TermsBerry, Textual Arc, and Links. My favorite visualization comes from the Cirrus tool because it creates a clear depiction of the visualization that emphasizes the most frequently used words. The biggest words are used the most across all memoirs, while the smaller words are used less. “Heart”, “Dear”, and “Congregation” are just few of the many words, but they are seen as the largest words using this tool.

Overall, I think that my group members and I are very proud of the work that we have put into this project and website. The most important part of this whole project is that we got to explore the lives of Moravian people through analyzing their work. We had fun creating this website together and even added a special tab that includes Moravian Music which you can listen to while exploring the site. Even though there was a lot that was involved in creating this project, it made the semester fly by and I’m really going to miss working with Ethan, Brendan, and Sam as well as these memoirs. I hope you enjoy our website just as much as I do!

http://bethlehemhumn100.blogs.bucknell.edu


P.S. Thank you for a great semester!


Categories
final blog

Final Blog

For our final project in this class, we were assigned to construct the design of a website and input all information involving our memoir that we have gathered this semester that helps us answer our research question. For my group’s memoir, Elizabeth Grundy, we formulated a research question around the women’s religion and family – were there different relationships between allegiance to family and allegiance to church in Moravian lives?

The Memoir section is primarily focused on how we comprised the initial electronic writings of Elizabeth Grundy. The effort that went into careful identification of words in the first few pages because by the fourth or fifth page most of our group had mastered it. The most difficult part of this was trying to identify some names of people or places. Unlike Professor Faull, my group was not well versed in the locations in Northern England so we messed up a lot of place names when transcribing. Once we electronically transcribed Grundy’s memoir, we were able to transport it into a TEI file to dive deeper into the life of Elizabeth Grundy. With a TEI file comprised of the entire memoir, we began to mark it up by tagging words or phrases in the writing that we thought would be important: placeNames, persNames(person names), roleNames, objects, health, emotions, and events. All of this work did not help us answer our research question, but it was the first, and most important, step to do so.

Before we marked up our TEI file, we made a copy in a electronic document of our completed memoir to use for Voyant Tools. Voyant is a text analyzer that allows users to interact with their data digitally and also what my group used to gather the data found under the Visualizations tab. Voyant gives access to an extensive amount of tools that allows you to analyze your documents. Two key tools my group used in our analysis of Grundy’s memoir were Trends and Word Tree. Trends is a visualization that displays the frequencies of certain terms within a document whereas Word Tree shows the collocates of certain words. These tools gave us our first data to answer our research question because they help us, “perceive patterns in data that we may have otherwise missed”(Whitley, 187). Trends showed us that the words Grundy used most frequently were “savior”, ”jesus”, “god”, and “son” and Word Tree showed us that the first three terms were used in very religious ways(“dear savior”, “my savior”) and that the most used collocate for “son” is “my”, which means she loves to talk about her son. This helps us understand that while Grundy does pledge herself highly towards religion, she still loves her family a great amount.

Two more tabs that are visualizations but we considered to have more information are the Story Map tab and the Timeline tab. These two both engage users much more in the geospatial visual that Bodenheimer believes in. This geospatial elements is a, “complex relativistic view of space [that] has reinvigorated geography”(14). The timeline and story map help a lot with the understanding of this geospatial element. When I was writing and reading Grundy’s memoir, I never actually considered where or when it was all happening. This element actually helps me answer our research question. Based on our story map and timeline, we can tell that Grundy did move away from her family and her kids to be more involved with her faith. However, it’s not like she left the country to somewhere remote; she stayed very close to where her family lived. She even visited her daughter at certain times – one being when she gave birth and sadly passed away. This helps my group understand that even though Grundy’s allegiance to faith was very important, she still wanted to be close to her family. This would have been something I would not have pieced together had it not been for the timeline and story map.

The final tab we worked on was Moravian Women. In my opinion, this was one of the most interesting tabs because I got to read about other Moravian women other than Elizabeth Grundy. For this section, I went a read a lot of sections of different women from Professor Faull’s book: Moravian Women’s Memoirs. Of the few sections that were available for free, I was able to read about some single and married Moravian women. This was perfect because Grundy was a widow so, in total, I was able to read about three different types of Moravian women. This gave me so much information to work with. The single women I read about were Maria Barbara Horn and Eva Lanius. Horn was completely involved in the Single Sisters and devoted her entire life to it – she moved to America because her Savior wanted her to. It was much different for Lanius: when she was rejected she began to live her life normally. A direct quote from Lanius after she was rejected from the Congregation in Bethlehem was that she, “began to like the world again.” Yet once Lanius got later accepted into the Congregation, her faith was rekindled. This showed me that if a woman was allowed the chance to join the Congregation, then her life was 100% committed to her faith, yet if she wasn’t, then she was more committed to family. For the married woman I read about,Johanette Maria Ettwein, her situation was a little different. She was married to a brother of the church so her family and faith were connected. Ettwein could live happily with her husband and serve her Congregation at the same time. Something I did not include in the website but I found interesting, was some reports of Moravian men on Professor Faull’s website (katiefaull.com). One of the ones I looked over was of Johannes Jungman. When he was younger, his allegiance was completely to family; he did everything with his family and everything his father wanted him to do, including moving to America, helping with his father’s distillery, and learning copper works. After nearly losing his leg when his sister burned it with brandy, he decided to meet up with his neighbors who happened to be brothers of the Church. They got him to move to Bethlehem, ditching his family to join the Congregation. This gives us another source for Moravian lives and different allegiances to family and faith. In his early years, Jungman loved his family and did everything he could to help, but eventually moved on to give full love to his Savior.

Overall, we found many different relationships between the allegiance to faith and the allegiance to family in Moravian lives. For some, their entire life revolves around the Congregation and for others they grow up until they realize what they truly believe in. All of our Voyant tools and geospatial visualizations helped us understand these relationships. When we started this semester, I had no idea what to expect of this class, but it turned out to be a very in depth and interesting course.


http://grundyhumn100.blogs.bucknell.edu/

Categories
final blog

Website Summary

http://tippetthumn100.blogs.bucknell.edu

All the work my group has done this year was in hopes of answering the question, “How did religion give Samuel Tippett and others during this time a new life?” This Final Project allowed my group to take every tool that we have learned this semester and put it on display, and it provided us with the opportunity to answer our research question with a multitude of data and representations. We started this semester with a simple task of transcription, and that first step, which at the time seemed tedious, produced the framework for me to explore completely new ways of analyzing literature. From the beginning of my schooling experience until the start of this year, I believed that there was only one way to approach literature. My whole life I have read material and formulate an argument via essays. These essays that I wrote in high school and middle school were completely structured and did not allow for much creativity. We had the simple guideline of an introduction followed by three body paragraphs and then a conclusion. I spent six years of my life writing essays the exact same way. This changed a little when I came to college, but that change really only came in being able to use more than three body paragraphs (not extremely exciting!). This class has provided me with a completely different way of creating and presenting an argument and this final project shows an accumulation of all new ways my team and I have been able to analyze our Memoir and answer our research question.

Our Website has two main components to it. We have separated our material into categories of Digital Edition and Visualization. Under Digital Edition we provide the viewer with an opportunity to see the original copy of Samuel Tippett’s memoir along with the digital edition we, as a group, created. We made the conscious decision to not include our work from Oxygen and Github because we believed that someone who does not understand how that software works would have a hard time understanding what it actually showed. We did use the data given to us from those websites and the activity of tagging in two of the visualization tools, “Google Fusion” and “Extracted Data”. Under the Visualization tab there are six different options to be clicked on. They are: Voyant, Important People, Important Places, Timeline, Google Fusion, and Story Map. All of these tools are used to analyze the same memoir, but they focus on different aspects of the text, or they focus on the same aspect of the text but provide a different analysis.

After we finished our transcription we were able to upload our transcription into a website that reads, analyzes, and produces creative visual representations of the data and patterns that summarize the texts. The most helpful tool that Voyant produced for me was the word cloud. Our word cloud showed me that the words used most frequently in Tippett’s memoir were “Heart”, “Lord”, and “Savior”. Based off of this word cloud without even reading the Memoir one would be able to see that religion played a major role in Tippett’s life, and as we moved forward in our analysis it became clearer and clearer that it indeed did.

The creation of our Timeline provided our group with a visual construction of Tippett’s life in a linear fashion. We understood that chronology is an important discipline in learning how to interpret the past. Before creating this timeline I was under the impression that timelines really only offered a list of facts that occured in chronological order with very little connection. After creating this timeline I had a completely different understanding of how timelines can be interpreted and how time itself works. I realized that timelines can offer a much more in depth analysis of data than I had previously believed possible. The Indian historian Romila Thapar, “long emphasized that genealogy and chronicle are not primitive efforts to write what would become history in other hands, but powerful, graphically dense ways of describing and interpreting the past.” (TIP-13)

After we finished our timelines we worked on creating Google Fusion tables. This exercise allowed us to generate visible relationships between two different entities. We chose to look at the relationship between Person Name and Place Name. Through this activity we were able to see that every person that Tippett mentions throughout his memoir has a connection to religion, further supporting the idea that religion played a role a major role in many people’s lives throughout this time period. Some important people mentioned were Brothers Cennick, Whitefield, and Wesley. Cennick, much like Tippett, was a misbehaved child who found a passion for religion later in life. Cennick witnessed his aunt, on her deathbed, completely at peace because of her relationship to the Lord. Cennick explans, “The words she uttered indeed pierced my soul, so that I could not rest day nor night, but wishing continually after, if I thought of death and sickness, O that I may be assured of heaven before I die!” (JStor-36) Wesley and Whitefield had a more traditional connection to religion. Religion played a major role in both of their early lives and then they both preceded to attend Oxford University where they discovered their passion for preaching. Both individuals were famous for the ability to connect with their audiences, and many even see Wesley as, “the founder of the methodist movement.” (UMC.org)

The final tool we learned to use the StoryMapJS. At first glance it may seem like StoryMapJS is simply a more complicated timeline, but it actually provides a platform to creatively use space as a way of presenting data. Bodenhamer explains, “We are drawn to issues of meaning, and space offers a way to understand fundamentally how we order our world” (14). In the context of our website, the spaces that we are trying to draw meaning to are cities and villages within the UK. Tippett began his life as a careless troublemaker, but as he grew older and older his perception of the world changed and he dedicated himself to Jesus and began a never ending journey of achieving Jesus’ forgiveness. The StoryMap tracks Tippett travels throughout this Journey.

Looking at the data that we compiled this semester, our group believes that we have proved religion did give Samuel Tippett a new life and most likely provided a similar experience for many other people. Through Voyant we were able to capture a glimpse of how religion centered Tippett’s memoir. The timeline provided us with evidence that every event important enough to be dated was related to religion. Finally both Google Fusion and StoryMapJS allowed us to see that anytime that Tippett changed locations it was with intentions to become more and more religious. Tippett’s life was dominated by religion during a time period coined “The Great Awakening”, so it is not outlandish to believe that many other people had similar experiences. My group looks forward for viewers of our website to make their own conclusions.

Categories
final blog

Final Blog Post

Given the implications in the name of the course itself, “Humanities 100”, it was only inevitable that this class had a consistent theme of analyzing the effects of digital humanities on society. It does not take a rocket scientist to figure out how drastically technology has changed the very world we live in today. For example, imagine the typical tourist wandering around the Big Apple. After maneuvering through the hordes of people glued to their cellphones, this tourist looks up and see the endless flashing monitors of Times Square. Finally, after a full day of festivities, this tourist finds his/her way back to their grandparents’ apartment who then proceed to complain how none of these fancy gadgets or screens even existed back in their generation. Needless to say, the world has experienced a technological explosion. The question is where did this sudden incorporation of technology derive from, and what are the consequences? A larger contributor is the creation of personal computing in the 1980s, which influenced people to view the world from a new lens. Society became quickly reliant on the internet with audio, visual, and graphical capabilities. Thus with due time, the field of digital humanities was created. The digital humanities are changing a world in which knowledge was taught through texts and stationary pictures and progressing to a world that produces and organizes knowledge through graphic designs and more. However, what is the advantage of implementing these graphics and visualizations towards internalizing text compared to traditional literature?

In his article “Visualizing the Archive”, Edward Whitley reflects upon how the human brain processes information. “Humans are quite adept at perceptual visual cues and recognizing subtle shape differences. In fact, it has been shown that humans can distinguish shape during the pre-attentive psychophysical process” (Whitley, 193). This fact entails that human brains are pre-wired to process and visualize shapes. The digital humanities provide the capability to turn complex bodies of text into software that can process this information into an extensive amount of graphs and even identify patterns. Nonetheless, it’s necessary to point out that not one single method of representing data is superior in every aspect. There are still benefits to reverting to the use of standard reading. For example, it’s intuitive that closely reading the actual text is going to provide the most accurate summary of the text and its details. However, it’s when texts become too long that the amount of information any individual can process begins to plateau. Whitley refers to this phenomenon in his article as the bottleneck effect. Only so many details can be remembered before the brain loses concentration and reaches its limits. For this very reason, digital humanities are advantageous in the the sense that complex texts can be simplified to be processed to the natural tendencies of the brain.

To provide some context on the capabilities of digital visualization tools, let’s focus on my favorite platform: Voyant tools. Originally, my group’s assignment was to review a 40-page digital archive of text written by Esther Latrobe and then decipher the text back into modern day English. This memoir had enough length to where the bottleneck effect started to kick in. Especially cause this document was written in a style of cursive and writing style that was unfamiliar. At first, we read the text document in it’s entirely like any other story one would read. We were provided numerous details on the several hardships that Latrobe endured. However, when we inputted the text of the memoir into Voyant Tools, the overlying themes became clearly apparent.

The picture above colorfully depicts the most frequent terms of the Latrobe’s memoir. It was now clear how strong a role religion played in her life because some of the most frequent terms included “god”, “lord”, and “saviour”. As Whitley would agree, Voyant Tools adhered to our brains’ tendency to register shapes and patterns. We now understood just how much religion really meant to Latrobe. It was this realization that shaped the research question of our final project.

Our research question was: How did Esther Latrobe’s relationship with God affect her lifestyle, and help her recover from such illnesses and hardships? Tragically, she was exposed to many harsh realities. For example, her mother died when she was only 11 years old. Additionally, she suffered from two diseases that nearly killed her both times. Keep in mind that the 1800s lacked the medical technologies that are available to the present world. Therefore, many diseases were lethal. To give light to how lethal diseases were from this time period, consider the Cholera Pandemic of 1817-1824.

This outbreak occurred during Latrobe’s life, which took the lives of over 400,000. The screenshot above is a picture from our timeline on our website. It was a miracle that Latrobe was able to survive not one, but two severe illnesses. In fact, her physician made several comments regarding how she had a shockingly high pain tolerance. Our group concluded that it was most likely her drive to maintain a close relationship with her “Saviour” that enabled her to become resilient, even against all odds. Another effect of her devotion to religion was its influences for her to travel, which was no cheap affair. To give a specific example, when she married James Latrobe, she had to move to Ayr Scotland because James had been called to service at the congregation there. “We are inherently spatial beings: we live in a physical world and routinely use spatial concepts of distance and direction to navigate our way through it (Bodenhamer, p. 14). As Bodenhamer believes, space is more than just for historical action. Space is a significant product and determinant of change. It was through this constant traveling that shaped the rich character that Latrobe developed.

However, as our group mentioned in our timeline, she lived a short life of only 28 years, and she died to Ayr Scottland soon after her marriage and giving birth.

Post URL: https://latrobehumn100.blogs.bucknell.edu/wp-admin/customize.php