Categories
Blog #3 contextual research

Blog #3 Jules Kim

As we learned about visualization tools in the previous units and compiled Moravian entries, it became apparent to me that the mode of representation directly affects the way in which people learn about ideas. If information is presented through text, it encourages the reader to read closely and look for specific details compared to images which give the reader visual aid to understand an idea. Timelines give both text and images to show chronology and geography which teach the reader when and where events happened and what they looked like. For example, in the Latrobe timeline, there are slides about education and sanitation practices that explain the cultural context for the 1800’s in Europe where Esther Latrobe wrote her memoirs.
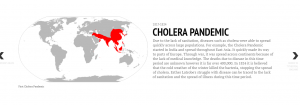
Chronology and geography clarify historical events when they are not biased or centered around one specific event because history cannot be objective in that case. For example, a timeline centered around Jesus’ life would most likely not include events like evolution and thus would not be informative to those looking for the scientific theories. Grafton says chronology “was the key to many practical matters such as knowing when to celebrate Easter” (11). Timelines not only record chronological events but also tell stories through the text and images of each event. In fact, Grafton states, “While history dealt in stories, chronology dealt in facts” (10). It is chronology that is credible and shapes historical stories. He uses annals as an example by saying although they do not explain cause and effect, the ways events recorded “represent a form closely calibrated to both the interests and the vision of their users” (12).  He explains how Annals of St. Gall was written in the Middle Ages when violence was prominent and thus the events were recorded in a passive tone because the events were said to have happened to people instead of people going through such events. That annal informs the reader of not only the events but the context for how people thought in that time period. Thus, timelines give contextual details like the time and location but also insight as to how people’s thoughts developed.

https://cdn.knightlab.com/libs/timeline3/latest/embed/index.html?source=1HEAoVGg_5j-psdjOKOBoOWKUpRTtp3x9L9dA8a5qASE&font=Default&lang=en&initial_zoom=2&height=650

Categories
Blog #3 contextual research

Blog #3: Timelines

I believe that chronology of events is extremely important because it allows us to see cause and effect. We would not be able to know and understand the outcome of any given event if we were not given the timing. There would be know way to learn from past mistakes or make changes in the future if  we were not given the chronology of events. As mentioned in Grafton’s introduction, timelines allow us to compare “individual histories to one another and the uniform progress of the years” in a manner where we can see the connections and development (Grafton 15). Chronology allows us to see patterns and identify relationships between different events which is vital in both learning and decision making. We can represent history both with chronology and geography which is what is encompassed in the timeline that Paige and I created. Even though “historical problems posed by graphic representations of time have largely been ignored” in the past and it may seem simple at first, a timeline can tell us an abundant amount about the past because it utilizes both chronology and geography which are essential in representing history (Grafton 10).

In order to create a timeline of Harriet Lees’ life,  Paige and I extracted key dates out of her memoir and placed them onto the timeline. We then had to do research to get a better context as to what was going on in Leominster, where she lived, and the surrounding areas during the time she was alive. By looking at where she lived and important events happening there during the early nineteenth century, we were utilizing the geographic mode of representation. We then found that the Industrial Revolution, Bath Houses, and the tuberculosis outbreak were big events going on during the time period in which Harriet Lees was alive. After putting those events into the timeline,  we immediately saw the correlation because we were able to use the chronological mode of representation. We saw how the events going on in Great Britain at the time intertwined with the struggles that Harriet Lees faced throughout her life. We would never have been able to draw these connections and conclusions without plotting this information on a timeline.

For example, we knew that Harriet Lees suffered from lung inflammation and was constantly ill, but we did not realize that her illness was a part of the larger tuberculosis outbreak that was going on in Great Britain.
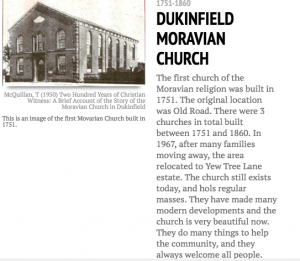
I am now able to have a better understanding of the complex relationship between ideas and modes of representation because I was able to visually see the cause and effect of events by each event’s location on the timeline and I could visually understand what the context of each event was from the pictures with the assistance of a short description. Putting this timeline together made me realize that a line, not just chronology can tell a story. The pictures and descriptions made what was just chronology come to life. The timeline we made models after chronographics which Grafton discussed in his introduction. However, I feel the layout of our timeline addresses the problem that chronographics had in the seventeenth century, “how to simplify, how to create a visual scheme to clearly communicate the uniformity, directionality, and irreversibility of historical time” (Grafton 19). Our timeline includes the visualizations; however, it does not lose site of the sequence of events.


[iframe src=’https://cdn.knightlab.com/libs/timeline3/latest/embed/index.html?source=13LSz87T6SWQHJEAbTZE6ZBNhhtDZGD5hMGe6mzC-SSY&font=Default&lang=en&initial_zoom=2&height=650′ width=’100%’ height=’650′ webkitallowfullscreen mozallowfullscreen allowfullscreen frameborder=’0′></iframe]

Categories
Blog #3 contextual research

Blog #3

Creating these timelines these last couple of classes has made me think about how important they are to history.  Without certain timelines with specific historical events, many things in history would be different, and for all we know, they could not exist.  Chronology on these timelines is the most important part. Without a specific order of when each thing happened, it is almost pointless to have timelines, because they need to be accurate in order to create resourceful information.  Chronology has been used for a very long time. In Grafton’s Introduction, he writes, “They began to plot events not just against long series of years, but against lunar and solar eclipses that could be dated precisely to the day and the hour” (17).  Historians and astronomers would use chronology in order to plot accurate points for things they would study. Many timelines are usually in a line, but I honestly do not think they need to be in a specific image, as long as the events are in the right order, then they will be able to be read correctly, and read the story.

So many extremely important events from history occurred because and were turned into timelines.  In Grafton’s introduction, they mentioned the Chart of Biography by Joseph Priestly. This is something that is still mentioned today because of timelines.  Another thing today that has many timelines are museums. In one of the images in Grafton’s introduction, there is an image from the Museum of Natural History in New York City, and it included a timeline.

The timelines that my group created in class include similar things to all of the timelines mentioned above.  The image below shows the separation of each event, and shows which event occurred first, and the order that followed.  This allows the viewers to know when everything occurred.


This image is of a specific event that occurred during the time of our memoir, and we were able to include an image that helped our timeline tell the best story.  It also tells the years during when this occurred.

Categories
Blog #2 contextual research

Grafton & TimelineJS Analysis

Blog # 2

Through reading Grafton’s Introduction, I learned that the two modes of representation are chronology and geography. These two modes immensely help clarify historical events, but they also obscure events. With regards to determining all there is to know about a certain event, these two modes help immensely because we know exactly WHEN and WHERE that particular event happened. With this, we can make deductions or inferences about why that said event occurred.

Timelines are actually less than 250 years old (Grafton 14). All they really are is a way of visualizing the numbers that we use to record our history, but they can also restrict our outlook on life. Grafton says “The timeline seems among the most inescapable metaphors we have” (Grafton 14). It makes time way more linear than it has to be and almost completely removes the flexibility of our concept of time. It has been hard to come to terms with these ideas and modes of representation, but I have done it successfully. By telling us a one-way story, they have told us a chronology of our perception of the world, but have also erased our opportunity to perceive time as a story.

This concept is actually extremely relevant to my group’s project. We were assigned the Bethlehem memoirs to transcribe an analyze. Other groups’ assignments were the memoir of one person, but we had several different writers to transcribe. So as other groups would have one coherent timeline for all of their events, we had 4 or 5 separate, overlaying timelines.

With this in mind, conceptualizing the complex relationship between ideas and modes of representation was near impossible. We were just given seemingly unrelated transcriptions with no background. We had to use different sources to get a deeper understanding of what we read. For example, Professor Faull gave me a book titled “A Tale of Two Plantations”, which depicted the lives of slaves in the Mesopotamian slave plantation in Jamaica, and how the Moravian missionaries brought the Gospel to them.


Viewing the timeline as a rigid linearity would be ineffective, as there are multiple stories going on at once. Grafton says that our idea of time “is so wrapped up with the metaphor of the line that taking them apart seems virtually impossible” (Grafton 13). The key here is flexibility, and being able to perceive several chronologies at once. TimeLine JS made this flexible view possible by stacking the different events on top of each other as they occurred.

Overall, using TimeLine JS made analyzing these events easier in that it gave a way to compare the events throughout time. This has given a deeper meaning to all of our separate work; it has integrated everything we’ve worked for together.