Categories
Blog #3

Blog #3

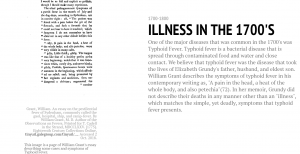
The chronology of events matter in history because it helps us understand things we may not be able to piece together just be reading some material. Timelines, for example, ‘compare individual histories to one another’(15) which allows us to notice possible patterns that may have played out in history. In order to create our timeline for Elizabeth Grundy’s memoir, we first had to do some distant reading. We created a Google Document that contained all important names, dates, places, and possible events that occured within our memoir. From there, we had to research historical events that connected to three of our important finds in the memoir. This is where we switched from distant reading to the creation of a timeline. The timeline helped us clarify what each event was because we went in depth on a few topics. What I chose to incorporate into our timeline was the “illness” that took the life of Grundy’s father, husband, and eldest son. Not until we found our three events did our timeline actually start to look like a timeline. While timelines outline important dates and events of some time period, they also obscure a lot of events that may not be “important enough” to be on a timeline. Whereas distant reading merely notes the important dates and events, a timeline is ‘ubiquitous in everyday representations of time’(14). However, chronology is not only applied to timelines. A large contributor to the visual metaphor was the map. At the time the map had become, ‘a key symbol of the power of knowledge itself’(17).

Categories
Blog #3

Blog #3

The concept of the timeline is a new phenomenon. In fact, it was only created around 250 years ago. Ancient and medieval historians had their own methods of representing chronology: the chronological table. However, now “our idea of time is so wrapped up with the metaphor of the line that taking them apart seems virtually impossible” (Grafton, p. 13). Presently, lines are more common than often perceived. For example, even in an analog clock, the hour and minute hands trace lines through space. The fact that these lines are circular is irrelevant; they are lines regardless. So what are the advantages of using a timeline?

“History, indeed is the body, but chronologie the soul of historical knowledge; for history without chronologie, or a relation of things past, without mentioning the times in which they were acted, is like a lump or embryo without articulation, or a carcass without life” (Grafton, p. 19). In his book “Cartographies of Time”, Anthony Grafton discusses how history deals with stories but chronology deals with facts. These aspects of time work symbiotically; without one or the other, a time period is not described to its fullest potential. For this reason, a simple line can be much more efficient in representing information than initially anticipated. Especially considering the fact that “Graphic representation is among our most important tools for organizing information” (Grafton, p. 10).

Using a timeline was helpful in painting a larger picture in understanding the general themes of Esther Latrobe’s memoir. A recurring theme was the suffering through diseases. The picture below represents the time period of a cholera epidemic. From this portion of the timeline, we can see how the dates 1817-1824 (when the epidemic occurred) were relevant to Latrobe because she lived through this time period. In this manner, the timeline provides contextual evidence from a single glance.

The picture below describes how from 1820-1830 she was not only educated but also became a teacher at a ladies boarding school in Ireland. From this information, we can conclude that she came from at least middle class because education was more rare for a female in this time period


Categories
Blog #3 contextual research

Blog #3: Timelines

The two modes of representation discussed in Grafton’s, Time in Print, are chronology and geography. By using these two modes of representation, it makes it easier for historians and researchers to piece or link together different pieces of information throughout history. Chronology allows one to determine the order of events while the geography allows one to determine where all of these events took place. The geography could help researchers determine common illnesses at that time in history or match together different groups that were in the same location at the same time. If researchers are able to determine the exact place something happened and the time it happened at, they can use this information and compare it to other information to clarify historical events.

Many times researchers have ideas about different events in history and how they are related. Researchers are able to use the two modes of representation, chronology and geography, to link together these events. Suppose there was a crime committed and there are two people in question. The detectives could use information about the place of the crime scene and the time the crime was committed at. They could then do research into the actions of these two people around the time of the crime and determine how close they were to the scene. These two modes allow researchers to relate events and arrive at conclusions that were otherwise be difficult to come to. Chronology can also be used in other ways. Grafton states, “For Christians, getting chronology right was the key to any practical matters such as knowing when to celebrate Easter and weighty ones such as knowing when the Apocalypse was nigh,” (Grafton 11). This mode of representation can be used to remember when specific calendar events occur or even predict when events in the future would occur.

On the other hand, knowing the time and place of a specific event could lead to incorrect assumptions about what happened at that event. One person may have just been in the wrong place at the wrong time and not been involved in the event but been mistaken as partaking in it. Chronology and geography cannot always verify events and link together some, but it can provide useful information that will aid in arriving at a conclusion even if it is not the correct one. Although at first glance, one may not think much of a timeline, I do believe it has the ability to tell a story. Grafton writes “Our claim is that the line is a much more complex and colorful figure than it is usually thought,” (Grafton 10). As one moves down the line, they pick up more and more useful information that they can then piece together to create a story. The line is of great importance, “In the graphic arts, the same holds true: from the most ancient images to the most modern, the line serves as a central figure in the representation of time,” (Grafton 14). As one can see, the line resembles much more than just something drawn on a paper.


a photo of how the events line up on the timeline


an example of one of the events on our timeline


https://cdn.knightlab.com/libs/timeline3/latest/embed/index.html?source=1MByvlaJQuG8LKCAz5jRj6eiHdwoiN4Iyr1o9VjHIl04&font=Default&lang=en&initial_zoom=2&height=650

Categories
Blog #3 contextual research

Blog #3

Making a timeline to represent the Bethlehem memoirs has been an extremely challenging, yet rewarding experience. As Anthony Grafton writes, “We get them, our students get them, [timelines] translate wonderfully from weighty analytic history books to thrilling narrative ones” (10). Grafton’s point is exactly right, by creating the timelines, we have been able to represent our complicated memoirs in a single story that flows across time, rather than just a chronology.

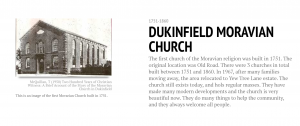
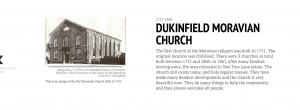
Photo of the Fulneck Moravian Chapel included in the timeline

When my group and I first began our timeline, the complex relationship between ideas and modes of representation overwhelmed us. We all had an idea of when each of our Moravians lived, but information beyond that was not immediately available. Because of this, we had to dig beyond just a simple Google search and dive into complex databases and other academic platforms, such as Old Maps Online. Although searching through the databases was more difficult than simply searching on Google, the resulting information I uncovered was spectacular and certainly added to the strength of our timeline. Specifically, I was able to find more specific details about the Fulneck Moravian Settlement in which Joseph Lingard lived. I even discovered some pictures of buildings that were built in the settlement!

Example of how our individual memoirs were stacked in the timeline

However, a problem we ran into as a group was how to mesh our separate memoirs into a cohesive timeline. Grafton speaks to this issue when he writes, “the key problem in chronographics, it turned out, was not how to design more complex visual schemes…but, rather, how to simplify, how to create a visual scheme to clearly communicate the uniformity, directionality, and irreversibility of historical time” (19). As a group, and with the help of Professor Faull, we decided that it would be best to stack our timelines on top of one another, a decision that led to even more interesting findings. By stacking our timelines the two modes of representation have clarified historical events because we were able to physically see when the lives of our Moravians overlapped in place and time.

All in all, I feel that creating this stacked timeline was important for my group because it allowed us to further interact with our memoirs and see that our Moravians lived in the same places and at the same time. This timeline will not only help our group understand the lives of our Moravians, but also will help others. After all, “graphic representation is among our more important tools for organizing information” (10).