Categories
Blog #3 contextual research

Timelines

This shows the intersection of history, chronology, and geography.

In the process of compiling information for our timeline on Esther Latrobe’s life, I have noticed that there are various modes of representation we could use. There are so many unique ways in which ideas can be represented visually, including diagrams, timelines, charts, and other pictorial methods. I agree with Grafton’s point, “graphic representation is among our most important tools for organizing information.” (Grafton 10) Two modes of representation in particular, chronology and geography, have clarified historical events by providing the time and place of these occurrences. Chronology provides structure and organization to all of these events by providing specific times. Geography on the other hand pinpoints the location of events so you can see what is happening on a global scale. While chronology and geography provide important information about history, it does obscure certain aspects of these events. For example, these two modes of representation don’t illustrate cause and effect and don’t dive into the details of history. They don’t analyze why certain things happened or how they occurred either. No, a line doesn’t tell us a full story, but it definitely does help with chronology; “from the most ancient images to the most modern, the line serves as a central figure in the representation of time.” (Grafton 14)
The timeline on the bottom portion of the image shows time represented in a linear fashion.

While I don’t believe a line can tell a comprehensive story, lines can be manipulated and shaped to try and represent more than just linear information. Changing length, color, or boldness of a line could all be indicators of something different in a visual representation of a historical event. It is difficult for a line to tell a story because “historical narrative is not linear. It moves backward and forward making comparisons and contrasts, and branches irregularly following plots and subplots.” (Grafton 20)


[iframe src=’https://cdn.knightlab.com/libs/timeline3/latest/embed/index.html?source=1HEAoVGg_5j-psdjOKOBoOWKUpRTtp3x9L9dA8a5qASE&font=Default&lang=en&initial_zoom=2&height=650′ width=’100%’ height=’650′ webkitallowfullscreen mozallowfullscreen allowfullscreen frameborder=’0′></iframe]

Categories
Blog #3 contextual research

Blog #3 on timelines

Timelines are relatively new sources of information, only formed as they are today in the middle of the 18th century (Grafton, 19). Grafton explains that the two sources of representation from a timeline are chronological, and geographical. Timelines help us to put events in a chronological order, clearly representing to us when each event happened. The linear passage of time is constantly moving, so putting each event in that order helps to make events more accessible. This allows us to view history in an orderly fashion, as without timelines, there would just be way too many scattered events to focus on. Instead, we are able to view events that happened on a specific date or time period. The geographical aspect of timelines allows researchers to know what events happened in each location. Specifically, we can view events happening at a particular location at the same time. Or we can look at the order of events in a certain location. By using both geographical and chronological modes of timelines, we are able to study the specific times and locations each event occured.

However, not every event should be studied in a chronological order. As Priestly stated, “historical narrative is not linear. It moves backward and forward making comparisons and subplots” (Grafton, 20). This was prevalent when viewing my timeline of John Willey’s life. Willey’s health began to deteriorate in 1804, however our timeline does not mention his suffrage again until 1843. This would lead many to believe that his health rebounded and he lived a healthy life. However, WIlley was constantly dealing with health issues throughout that period, he just maintained a positive outlook and continued his typical life. The line does tell the story of major events in Willey’s life, it just leaves out important aspects. But, when you do not have the time to research so much information, timelines “translate wonderfully from our weighty analytic  history books to thrilling narrative ones” (Grafton, 10). Lines are an excellent source of information for a quick overview, but they often require some more research to accurately understand the full story.

These two events are stacked on top of each other on our line, showing the quick timeframe between John Willey’s return to home and his passing away.

Categories
Blog #3 contextual research

blog #3

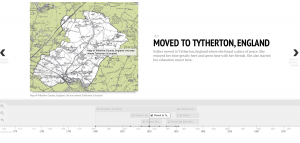
Grafton observes that “Teachers and theorists claimed, over and over again, that chronology and geography were the two eyes of history: sources of precise, unquestionable information, which introduced order to the apparent chaos of events”. Chronology of events is incredibly important in representing history. Chronology is defined as the arrangement of events or dates in the order of their occurrence. Chronological order is the most efficient and clear way to represent history. Timelines also show the progression of history in a very understandable way. Timelines are very helpful because they allow the viewer to compare past events with current ones. Because the progression of history is viewable in one setting, it is easy to also make predictions about possible future events.  Timelines usually entail descriptions of past events, their dates, and include pictures to aid in visualization of the event. As mentioned in “Cartographies of Time”, chronology has serious implications outside of the academic study area. Chronology is a greater part of our lives than we may realize. For Christians, “getting chronology right was the key to many practical matters such as knowing when to celebrate Easter and weighty ones such as knowing when the Apocalypse was high” (Grafton 11).  Through the ordeal of organizing media for the Moravian Lives timeline, I have realized how much it has clarified the historical events mentioned by Samuel Tippet. While dates and details are beneficial, having media to go along with it aids in further understanding. “Traditional chronograph forms performed both rote historical work and heavy conceptual lifting. They assembled, selected, and organized diverse bits of historical information in the form of dated list. And the chronologies of a given period may tell us as much about its visions of past and future as do its historical narratives.” (Grafton 11). Timelines allow us to view history in a way that goes beyond basic facts. A timeline’s concise and clear nature provides the viewer an opportunity to analyze and see history in an entertaining and fascinating way. My group’s timeline of Samuel Tippet’s life gives background knowledge of his upbringing, occupation, and various other facts. Samuel Tippet’s was born in the parish of Britton and lived from the early to mid 18th century. He was a very dark person and throughout his life turned to God and religion to aid him through challenges. We included pictures of the parishes as well as some geography of England on our timeline to help the reader understand what his life was like. The two modes of representation have clarified these historical events through conceptual analysis and visualization.

Screen-Shot-2018-10-03-at-9.59.37-AM-300x135.png

Screen-Shot-2018-10-03-at-9.59.48-AM-300x125.png

Categories
Blog #3 contextual research

Blog #3

When events are placed in chronological order it presents a visual of the order in which the events took place. This is important because when readers are presented with new and important information containing multiple dates, it’s hard to mentally sort out that information. As Grafton points out, creating a chronological order for events represents history in a way that is contextual, visual, and memorable. In my opinion, a line is capable of telling both a story and chronology of events that took place.

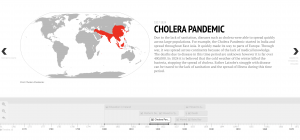
The above image shows how the line is represented in a spatially.

Through the Timeline.js project, I was able to understand how particular events in time influenced the decisions of the people from the memoirs and how it affected their lives. Because our memoir had so many components, we created our timeline by stacking the data. As a result, a line was created through space by the website. Grafton wrote about how W.J.T. Mitchell said, “The fact is that spatial form is the perceptual basis of our notion of time, that we literally cannot ‘tell time’ without the mediation of space” (13). As a group, a few of the dates that we had overlapped each other. If this information wasn’t stacked and written out chronologically, it would’ve been difficult to understand. Grafton made this point evident in his introduction by saying, “by comparing individual histories to one another and the uniform progress of the years, the reader could see the hand of providence at work” (15).

In this image you can see how the dates are stacked based on their chronology.

For myself, the most difficult part of this project was finding contextual events that correlated with my memoir. Once we each found dates that we felt suited this project, the timeline created a chronological story that was easily and better understood. Though it was difficult, our information allowed our group to explore the relationship between ideas and modes of representation. Overall, the information that we found added to the development of our timeline and furthered our understandings of the Bethlehem memoirs.