Categories
Blog #2

Nathan Ware’s Blog #2

My group’s project was to transcribe Esther Latrobe’s memoir. This memoir was a document written in script. After learning to decipher both the handwriting and general writing style of the text, we started to understand the life-story being described to us. Esther Latrobe was born on June 7th, 1802 in Bristol, Germany. She was the only daughter within a family of six children and was “tenderly loved” by both her siblings and parents (page 1). Early on, Latrobe was predisposed to a short life full of hardships. In her childhood, her first challenge was when she caught a deadly case of the measles. Although presently the measles is a relatively easy disease to cure with a high survival rate, such a disease was much more lethal in the 1800s due to a lack of medical resources. This sickness brought her to the brink of death, but with the strength of God, she became well again. A recurring theme within this memoir is her religious faith. She was brought up within a strict Catholic family. From reading this document, the reader can infer that through the many hardships she faced, Latrobe relied on her faith with God to keep moving forward. In fact, her physician always claimed that she had a shockingly high pain tolerance. To prove this claim, she also suffered from a rheumatic fever and heart problems that nearly killed her. However, yet again, she survived. The next devastation she endured was the death of her mother when she was only 11 years old. As the saying goes, nothing cuts deeper than a wounded heart. This wound scarred deeply into her heart, and she often wept in remembrance of her beloved mother. Nonetheless, through the acknowledgment of her friends, she felt the love that drove her to live on with her life. Consistently throughout the memoir, Latrobe looked to God for forgiveness, and then she reflected upon these wrongdoings to become a better person and strengthen her relationship with the Saviour. Even though she had deep emotional ties to the town of Tytherton, in which she spent over 6 years there, she went to Gracehill in 1826 to become a teacher at the “Ladies Boarding School”. Eventually, she went to Ayr and got married to Brother James Latrobe on the 28th of December. Later on, after going through labor for 4 days, she gave birth to a healthy boy on Friday, October 15th. Tragically, after living only 28 years, she died from illness. However, she honorably accepted death and asked her husband and other loved ones not to cry for her because she was now in the hands of the Lord.

After transcribing this document, we inputted our finished text into voyant tools. Within this transcription there are 8496 total words; of these words, 1809 of them are unique word forms. The most frequent terms are synonyms of the word “God” and also the collocates of these synonyms. For example, “Lord” is used 51 times, “Savior” is used 22 times and the word “God” itself is used 26 times. The word “oh” is used 37 times and is collocated with “God” 5 times and collocated with “Saviour” 4 times. The word “dear” is used 33 times and is collocated with “Saviour” 6 times. In the Bethlehem memoir transcribed by another group, they shared the frequent terms “Saviour” and “dear”. By comparing these frequent terms, the viewer can conclude that religion played an important role in the lives of the people from the 1800s.

All this data given to us through voyant tools takes us back to one critical question: What does this data and textual analysis provide to us that standard literature fails to do? “Humans are quite adept at perceptual visual cues and recognizing subtle shape differences. In fact, it has been shown that humans can distinguish shape during the pre-attentive psychophysical process” (Whitley, 193). In his article “Visualizing the Archive”, Edward Whitley explains how the brain is wired to recognize shapes and patterns.  


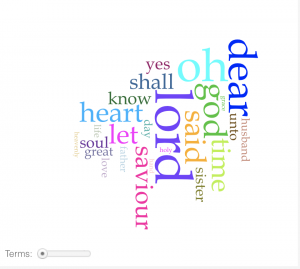
The picture above is a picture of the Cirrus tool from Voyant tools. Just by looking at this representation of the most frequent words, the reader can physically see the religious pattern of the text. Our group’s research question was: “How did Esther Latrobe’s relationship with God affect her lifestyle, and help her recover from such illnesses and hardships?” Without reading Latrobe’s complex and lengthy memoir, our group easily got insight on the importance of religion within her life. Whitley also argues how digital humanities is superior to traditional literature in the sense of how complex text introduces the factor of the bottleneck effect. Although standard reading encourages the reader to pay closer attention, the human brain cannot sustain large intakes of information. When a text becomes too long, visualization tools and graphical analysis is useful. 


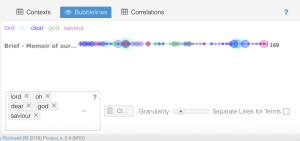
The visualization above is the tool Bubblelines. This tool spaces out the frequencies of the terms inputted and outputs them as a timeline. In this case, the input was the 5 most common words. Now the viewer would register that not only is religion a recurring topic but this topic is also consistently used throughout the entire memoir. However, as Whitley would agree, the field of Digital Humanities is not perfect. Sometimes, the reader needs the context of the story that only the close reading of literature can provide.

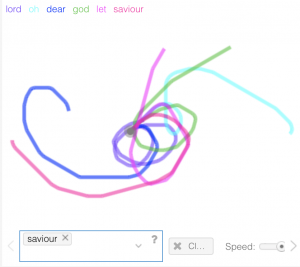
The picture above is the Knots tool. In this tool, you can click on any point of the lines and see the context in which the word was used within the text. However, by no possible means could you understand the in-depth life story of Latrobe from this graphical analysis.


Categories
Assignment #1

Ester Latrobe Transcription

http://moravian.bucknell.edu/memoirs/Esther-Latrobe/

Google Doc:

https://docs.google.com/document/d/1JskmdGh4grdhqHksXQmYSCRA0D3VlchO1ceAMjTDobo/edit


My group’s assignment was to review a 40-page digital archive of text written by Esther Latrobe and then decipher the text back into modern day English. This literature was handwritten in script using an old English dialect from the 1800’s. Personally, I found transcribing this document challenging because script is not a common form of writing that I am used to reading. Ironically, the elementary school teachers who insisted that the real world used script were mistaken. After a couple weeks of writing in script, I reverted back to writing standardly and rarely saw the use of script ever again. The first curveball thrown at our group while transcribing these documents was when we encountered double letters. In script, a double letter results in one large letter next to a smaller version of that letter. This concept was difficult to pick up on first but once you recognize what these double letters looked like the words became rather simple to read, which seemed to be the general theme of this process. We started to recognize the style of the handwriting, making the deciphering process even easier. However, a major dilemma was the quality of the pictures that were provided. Since we had a larger document compared to other groups, a significant portion of our archive provided blurry pictures. However, after contacting a London archivist, we were quicked given a pdf of a clear version.

I found it interesting to learn about the differences in the linguistic style of Latrobe and colloquial English. For example, since Latrobe was quite religious the text had a lot of content about the “Saviour” instead of using the word “Savior”. Another recurring word was “thou” and “thy”. When our group finished transcribing the document, we had to reach a consensus on how we wanted to tag the transcribed words. We were slightly unclear on whether we wanted to tag all prepositions such as “she” or “her” as people or all any type of word that suggested people such as “daughter” or “family” in the people category. However, in the end, we decided on just tagging all proper nouns in the people category.

Categories
Blog #1

Nathan Ware’s Blog post #1

Throughout the last few decades, the world has experienced a technological explosion. What I mean by this statement is that society is progressively becoming tech-savvy. As a result of recent trends, such as the rise of personal computing in the late 1980’s, society can now view the world through a new lens. These computers transformed the world into an environment reliant on the internet with audio, visuals, and graphics. Consequently, the field of Digital Humanities was created. What was once a civilization reliant on traditional literature, is now being transitioned to use visualization to offer additional interpretations to standard text.

Digital Humanities is changing a world in which knowledge was taught through texts and stationary pictures and progressing to a world that produces and organizes knowledge through graphic designs and more. Now, multiple authors can work collaboratively and efficiently through the new age of technology to create a product that adheres to human’s natural tendency to register shapes and patterns. However, any abrupt changes to society inevitably result in reluctant critics. These critics call upon an important question: What are the benefits and detriments of creating a digital artifact compared to an archival document?  

An effective starting point to this argument would be to consider what ways digital versions of material texts highlight physical elements of texts that might otherwise pass unremarked. In his article “Visualizing the Archive”, Edward Whitley reflects upon how the human brain processes information. “Humans are quite adept at perceptual visual cues and recognizing subtle shape differences. In fact, it has been shown that humans can distinguish shape during the pre-attentive psychophysical process” (Whitley, 193). This fact entails that human brains are pre-wired to process and visualize shapes. While critics point out that traditional text encourages the reader to absorb the details of the material by reading more attentively, this benefit is outweighed when the text becomes too complex. The human brain can only take in a finite amount of information before details are lost. The Digital Humanities offer a solution to this problem by graphically displaying information that summarizes text in a way that’s easier on the human mind. By visualizing commonalities of the text, the viewer experiences serendipitous discovery of underlying themes that would have remained unapparent through standard text.

The picture below is from the project called “Lincoln at 200”. This project is connected to a website that allows the viewer to navigate through two website exhibitions. By adding structure to this website, the reader can view text documents in an organized manner. If it were a traditional text, the viewer would miss out on this organization leading to that person to interpret the reading less accurately. Using websites such as this one, scholars can create online reading interfaces that can more closely approximate the experience of reading physical materials.


On the other hand, literature provides some perks that computers can’t. Since computers were a recent invention, history is discovered through mainly literature. In the project called “Old Weather”, ship logs from the 19th and 20th century are vital for climate scientists. However, the handwriting can’t be processed by computers. Only the human eye can read these documents. The picture below is an example of one of these ship logs. By decrypting the text into modern English, not only can we sample the lives of these sailors, but scientists can grasp a better understanding of their climate.


Categories
Practice Blog

Nathan Ware’s Practice Blog

As discussed in the Whitley reading, there are advantages to both traditional literature and today’s textual visualization technologies. While reading literature, a reader is encouraged to read more closely, paying attention to what the author is trying to allude to. This style of reading is great for reflecting on the details of a text in order to form your own interpretations. However, in a text that is sophisticated and long, readers can suffer through a bottleneck syndrome. When complex themes sequentially accumulate, the reader becomes easily overwhelmed. Therefore, using graphing technologies to create a visual representation of text can adhere to a person’s natural capabilities to recognize shapes and patterns. In Micki Kaufman’s project “Quantifying Kissinger”, Kaufman wanted to create a digital national security archive that would make analyzing large archives easier and more convenient for historians. The picture below presents a static text plot that displays tendrils of specificity that shed light on patterns of specific words. This information allows the viewer to visualize data in a way not available to the naked eye when just viewing text.

Using similar visualization technologies, the Belfast Group connected many authors in North Ireland with their writing workshop. Although this group unfortunately stopped meeting in the early 1970’s, their work is still studied in the present. To give a specific example, students in Emory University created a “Manuscript, Archive, and Rare Book Library” that has a large collection of their poems. Through this database, the “NameDropper software” was created, which allowed computers to make sense of the people and places mentioned within the group’s poetry. Once this information is represented graphically, the viewer can visualize the relations between each member of the group. In the example below, one can infer from the proximity of one author from another that some had more connections with specific members than others.