Categories
Blog #2

Blog #2

After transcribing and reading our memoir about Elizabeth Grundy, Voyant Tools allowed me and my group to visualize our text in a new fashion. Once we had taken some time to assess our memoir, we came up with a research question stated as: “How does the frequency of the key terms change throughout the document?” As Professor Faull told us in class, most groups have some of the same key terms (savior, god, jesus). So our question was designed to see how and when Elizabeth Grundy decided to use these terms throughout her memoir.

Elizabeth Grundy’s memoir is about her journey through faith as she lost loved ones. The loss of her father, her husband, and her eldest child, all through illness, had her confused about her true beliefs. This helps lead us into the five key terms that were used throughout the entire memoir: ‘savior’ used 34 times; ‘time’ used 18 times; ‘son’ used 17 times; ‘god’ used 16 times; ‘jesus’ used 16 times. This is my first real use of distant reading which Whitley describes as, “looking over the broad patterns of a text.”

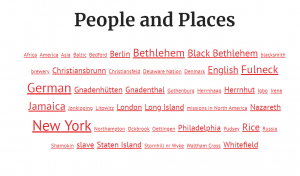
The first tool I used to help visualize these terms was Cirrus. Cirrus is a word cloud that visualizes the most frequently used terms in a document.  Even though Cirrus is one of the most common tools of visualization, it plays an important role in distant reading. Cirrus is very useful because not only does it show the five most frequent terms that appear in the Summary tab on Voyant, but also the frequency of other words. This helped us answer our research question because it gave us a nice baseline visualization on the frequency of words in our memoir. 

[iframe style=’width: 424px; height: 294px;’ src=’//voyant-tools.org/tool/Cirrus/?corpus=486449dbc605c4e77ecaa99e423bb935′][/iframe]


While Cirrus gives the frequencies of words, StreamGraph works a little differently. Streamgraph is a Voyant tool that depicts the change in frequency of words in a document or corpus. It splits up your text into ‘Document Segments’(the x-axis) and that helps you determine from the graph how often words were used in which segments. “Savior” is the most frequent term in our document and, based on the StreamGraph, it is also the most frequently used word throughout the memoir. What I mean by this is that ‘savior’ was not just used 30 times in one section then forgotten about, it was the most spread out word in the memoir. This Voyant tool helps us answer our research question because it shows the relative frequency of the five most frequent words. With this we can assess how often terms are used in which parts of the memoir. For example, around Document Segment 15, we see that the term “jesus” was used a whole lot of times whereas it was hardly used in the beginning of the text.

[iframe style=’width: 424px; height: 294px;’ src=’//voyant-tools.org/tool/StreamGraph/?docId=c07c78025c913d7a2670603c760ceb25&corpus=486449dbc605c4e77ecaa99e423bb935′][/iframe]


Now that we had figured out frequencies and relative frequencies of the key terms, we decided to work a little with their collocates. Using WordTree, we were able to identify how Grundy was using these terms in her memoir. While I was expecting four of the five key terms in our document (savior, god, jesus, and son-because she had two sons), I was a little confused as to why time was one of the key terms. In the WordTree for time, three of the five left continuations are ‘another’,’this’, and ‘any’. With these continuations, Grundy is telling us stories of her life at these instances (another time…, this time…, any time…). This Voyant tool helped us answer our question because it put into perspective how Grundy was using these terms. All of these tools helped us “perceive patterns in data that we may have otherwise missed”(187) and helped guide us along to answer our research question.

[iframe style=’width: 424px; height: 294px;’ src=’//voyant-tools.org/tool/WordTree/?query=savior&corpus=486449dbc605c4e77ecaa99e423bb935′][/iframe]

So while the StreamGraph was the most direct answer to our research question, the Cirrus helped us discover what other terms were frequently used, and the WordTree helped us figure out collocates of the five terms so that we knew the context she used those terms in.

Johanna Drucker defined visualization in the Whitley reading as a way to “integrate interpretation into digitization in a popular way” and I believe that exploring Voyant with our memoir and these tools made for a very enjoyable assignment.

Categories
Assignment #1

Assignment #1

I never thought that just transcribing a document would make you understand the story of the person that wrote the it. While writing, the only thing you focus on is what each individual words is, and nothing about the author. For five pages, I struggled to read cursive because I have not seen the style in years. I had to look over the cheat sheets for cursive letters once we started because I just could not remember what some of the letters looked like. In the moment, you don’t really care what the person is saying, you are just trying to figure out what each word is. After finishing my five pages, with lots of question marks, I then had to go back and get help from others. Sometimes, it is just about asking the right person. Some people might know a lot more cursive than others. For example, in our group Meg Koczur remembered her cursive very well so I would ask her for help a lot. Then once you are finally done nitpicking words, you can reread your work to double check everything. Once you get to this point is when you really begin to feel a connection with the author. It is so interesting that none of these documents have never been written so we are the first ones to actually read it. They are just simple documents in which people talk about experiences they had. In Elizabeth Grundy’s work, some of the times she was just talking about some of her dreams. It just made me overjoyed to be able to read about somebody else’s life. Coming into this class, I did not really know what to expect from digital humanities, but this really changed my mind for the better.


https://docs.google.com/document/d/1Nv-N7N0rR6puaTNT2_QHv_918cxgYppQjCQikAxSNqQ/edit?usp=sharing

Categories
Blog #1

Blog #1

I believe that we have started to look at textual material on the screen more than on a manuscript/printed page. Why go to the document when you can bring the document to you?  The rise of technology is what is forcing humanities toward digital humanities: it has become effortless to pull up a document on your phone or computer. This switch to digital humanities means the research practices in the humanities must change as well. For digital humanities, a change in research practices does not simply mean understanding how to scan and upload documents. A large portion of the practice requires understanding of the use of visualization In the Whitley reading, Johanna Trucker defined visualization as, “A methodological reversal which makes visualization a procedure rather than a product and integrates interpretation into digitization in a popular way.” I love how she defined this because the last eight words really capture the essence of digital humanities: ‘integrates interpretation into digitization in a popular way.’ With the help of visualization, humanities will not fall behind in the wave of technological advance.

Digitized materials supplant the need to view to physical original copies. With the transition to visualization in the work of digital humanities, new ways of reading have come about. According to the Whitley reading, two new ways of reading are spatial reading and distant reading. Spatial reading means extracting the valuable information from a text so that you do not have to read it in a normal manner. Distant reading refers to stepping back and looking at trends between thousands of books/documents over time. These two new forms of reading supplant the need to view the original copies. I am not saying that we should just throw out the physical copies, but as long as we scan them, then we should not need to use them as much anymore.

Example of distant reading

I would say there is not yet a consensus for digitizing and editing archival material. However, that does not mean that some common practices for digitizing material have not arisen. One practice that was mentioned in the Whitley reading is tag clouds. These tag clouds can be designed in different ways, but their main use is to show the statistics for word count or word uniqueness in a document. Tag clouds are used to turn reading from a qualitative process to a quantitative process. The biggest advancement of tag clouds is that it connects with the idea of distant reading. By using tag clouds to look at word uniqueness in different documents, we can see how the uniqueness of words has changed over time. Tag clouds are even used on the DH site to show the most common places that have come up in their documents.

Example of a tag cloud on the DH site


Categories
Practice Blog

Visualization and Preservation

The primary focus of Adrian S. Wisnicki’s project, Livingstone’s 1871 Field Diary, is preservation. Due to not having the proper technology, David Livingstone’s field diary had remained unpublished and inaccessible. By using spectral imaging and processing technology, the project team was able to decipher what was written in the original diary. Preservation is one of the most important topics when dealing with digital humanities. If we are not able to preserve the old texts, then we will never be able to transcribe them, meaning we will never get to read them. Preservation does not come with just old diaries, such as in the case of David Livingstone, but also with historical maps and records.

The primary focus of the project, Selfiecity, is visualization. By obtaining selfies from thousands of people worldwide and compressing them into a collage, it becomes possible to analyze demographic patterns of selfies. It may seem unnecessary to study selfies of people, but interesting findings have come out of the project – one finding being happiness. Of the cities studied, Bangkok has the highest ‘smile rating’ with 68% of selfies being smiles whereas Moscow had a 53% smile rating. In a study of social media patterns, it was very smart for the Selfiecity group to use the visualization method. Currently, Snapchat and Instagram comprise a large portion of social media where both medias are about posting or taking pictures of yourself. It would be much harder for Selfiecity to explain their findings if they did not have photographic evidence to back up their findings.