Categories
final blog

Final Blog

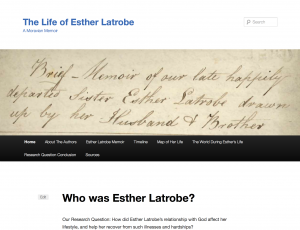
Overall, I was happy with how our final digital artifact, our wordpress website, turned out. It was a nice way to display everything we have created and learned this year about Esther Latrobe, her journey/life, and the different digital tools and artifacts we used. After some deliberation, we chose a simple and clean theme that didn’t have too many spaces for pictures. We wanted the focus to be on the text and on Esther. It was hard to choose a theme because many of them were picture oriented. But, we decided a great picture to display on the homepage would be the first excerpt from Esther Latrobe’s actual memoir. It includes her full name and the cursive handwriting looks elegant. We wanted this to be the first thing users saw because that’s where it all began for us.

Our homepage on our website featuring the excerpt from Esther’s memoir

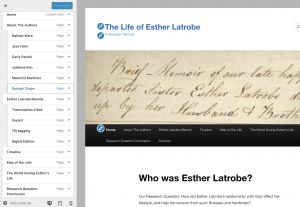
We played around with the website for a bit and tried to see how everything worked. We included a page with the summary of her life and research question, an About the Authors page, a copy of her memoir, the transcription desk, voyant, TEI tagging, the digital edition, the timeline, the story map, contextual events, our research question conclusion, and our sources page. We used a couple of drop down menus along the toolbar so it wouldn’t appear too cluttered for users.

The editing process of our different pages and drop down menus

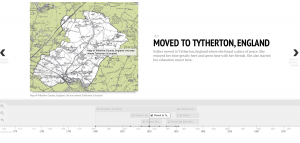
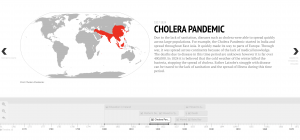
We included a summary so people could get some background information on Esther’s life and we added our research question and conclusions so users would understand what our focus was throughout the semester. We wanted to include a clean copy of her memoir so people could see the actual memoir. It is so cool to see the original document, even if it is in picture form, because users can see what we were working with and see how people wrote back then. The beautiful cursive is very different than how we handwrite things today. We also included pages devoted to the transcription desk, voyant, and TEI tagging so everyone would understand the process it took to properly transcribe and extract information from this text. I think one of the most important pieces was the digital edition, which is “ a derivative document that holds a relationship with the transcribed document, and [a digital edition is] a formal (public) presentation of such a derivative document.” (Pierazzo 2). It was so cool that we created the first digital edition of this memoir ever. It is easily accessible now; you don’t need to travel and dig through an old archive, you can just hop on the internet at your convenience. The timeline was one of our biggest projects so it was important that it be included as well. We were able to see her life as an organized series of events. It was helpful and easier to analyze her life this way. I also thought the map was very important too, because you could really visualize her life and see how far she traveled. When looking at the map we were able to find background information on every place she lived. For example, I used https://history.wiltshire.gov.uk/community/getchurch.php and www.gracehillvillage.org to find out information on Tytherton and Gracehill respectively, two places with Moravian origins, and two of the places Esther lived. Finally, we decided to have a page called The World During Esther’s Life. We felt it was important to include context and explain what was going on in this time period. We can look at the big picture and see how world events impacted one life. We embedded certain things like the story map and the timeline, and we included screenshots of other tools we used.

The Timeline page on our website

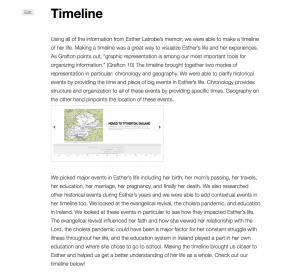
We assigned each other different roles for the website and one of my main responsibilities for this site was creating her timeline page. I chose her timeline because, “graphic representation is among our most important tools for organizing information.” (Grafton 10). I wrote about the process of creating her timeline, the events we decided to include, and how it gave us a better look at Esther’s life. I added a screenshot and embedded the actual timeline so users can scroll through our actual work. In addition,  we ran into some challenges with simply formatting and navigating the wordpress site. For example, it took us a little bit of time to actually create the drop down menus. Luckily, one of our group members had experience with this program and helped us figure it out. Our research question was, How did Esther Latrobe’s relationship with God affect her lifestyle, and help her recover from such illnesses and hardships? We came up with this question after carefully reading her forty page memoir. We noticed that Esther was very devoted to her religion and she unfortunately spent most of her short life ill. So, we decided to put those two aspects together and analyze her life with this in mind. I believe that the digital tools we used throughout the semester helped us answer this question. Every tool we used aided us in examining her memoir in different ways and we really got an inside look at what her life was like. I thought it was helpful having the snap talk because it was basically all of the information from our website in a google slides presentation. I thought that our group worked very well together throughout the whole semester. We worked as a cohesive unit and got all of our work done. It was a fascinating experience working in a group for basically the whole semester, luckily we didn’t have too many problems if at all. Everyone was open minded and it was useful having five other people I knew I could rely on in the class. Every assignment and digital tool we used brought us closer to understanding Esther Latrobe’s life. 


http://latrobehumn100.blogs.bucknell.edu


Categories
Blog #5

Story Map

Mapping and spatial visualization is the convergence between history and geography. These maps revealed the distance traveled by the authors of the memoirs; we get a better picture of their actual journeys. With the spotlight on locations, there was a focus on where these people spent their time. We can use maps and spatial thinking to help us understand the complexities and nuances of history by narrowing in on the location. “Spaces are not simply the setting for historical action but are a significant product and determinant of change.” (Bodenhamer 16) Mapping Esther Latrobe’s memoir revealed more detail about her life’s journey. StoryMap JS helped me “to develop interactive systems, and to explore space and place dynamically- in effect, to create virtual worlds embodying what we know about space and place.” (Bodenhamer 24) Maps are a great visual aid that allows us to  actually see where Esther moved in her life. I can see how far she actually traveled and how close or far away each place was in relation to each other. For example, Tytherton and Gracehill are very far from each other, so I was surprised that Esther didn’t elaborate on her travels. With the lack of airplanes, cars, etc it must have been a long and fascinating journey. Learning more about the places she lived also helped me get a better understanding of her life. She didn’t move around too much, but every significant place she lived in was tied to her faith and the Moravians. I created story points at the four places Esther lived during her life. The first was her birthplace: Bristol, England, which was a bustling port city that thrived from tobacco and the slave trade. Next was Tytherton, England, which was a small town in England founded by Moravians. Next was Gracehill, Ireland, which is a famous Moravian settlement and is known for their school and superior education. And finally there was Ayr, Scotland, which was another prosperous port city. Esther was drawn here because her husband was called to the service of the congregation in Ayr; yet another example of movement due to her Moravian ties. While significant events in her life occurred at all of these places, the places themselves were also growing and changing. “They are not passive settings but the medium for the development of culture. All spaces contain embedded stories based on what has happened there. These stories are both individual and collective, and each of them link geography (space) and history (time).” (Bodenhamer 16) Half of the places Esther lived in were thriving port cities and the other half were very popular and well known amongst her network of people in the Moravian community.


[iframe src=”https://uploads.knightlab.com/storymapjs/6540fcc608e11b3a95c6817901262cee/ester-latrobes-life/index.html” frameborder=”0″ width=”100%” height=”800″][/iframe]


Categories
Blog #4

Blog #4 TEI Tagging

We tagged God and its synonyms as a person. This emphasized how faithful Esther Latrobe was.

Marking up the Latrobe transcription has definitely increased my understanding of the text. During the transcription phase I felt that I had a decent understanding of my pages, but not the whole memoir. While marking up my section I got an even closer look at the text. The tagging focused on places, dates, names, events, emotions, objects, health, and organizations. It was fascinating to see that emotions dominated Esther’s memoir. Names, most notably synonyms for God such as Lord and Saviour, were also seen frequently throughout the text. I also felt that I got a better understanding of the whole text since I had to read through the entire memoir while checking for tags.

This shows how we tagged people, places, emotions, and dates.

Working with a group of peers is a challenge in this process. Since we had the longest memoir (40 pages), we had a larger group of six editors. Overall, I thought we worked well together, but we needed a lot of communication while tagging. For example, we decided to mark all proper nouns and synonyms of God as people. The biggest challenge was tagging emotion. We decided to tag any word that described a type of feeling as an emotion. We would check in with each other throughout the TEI tagging process if we were unsure about something. We’d ask about certain phrases or words to the whole editorial board, and then we would decide as a group if we thought it counted as an emotion or not. Hearing input from everyone and making decisions as a team was imperative. The markup of the transcription really made me realize how much editors do and how much collaboration actually happens on a project like this. Lack of communication and teamwork, and the whole project will be full of inconsistencies. As a group we didn’t really have disputes, but we definitely had to talk about how to tag certain elements of the text. Additionally, I have realized that the digital edition of a transcribed text is really just based on how the editor views the text, “the process of selection is inevitably an interpretative act.” (465 Pierazzo) Markups depend on what editors decide to tag and how they tag it. For example, “two scholars, given the same transcriptional criteria, are most likely not to produce the same transcription of the same exemplar” (465 Pierazzo). Two people could interpret the text very differently and therefore produce two different versions of the same text. What we have created with our digital edition of Esther Latrobe’s memoir “is an interpretative, scholarly product, based on the selection of features transcribed from a specific primary source.” (Pierazzo 466)

Categories
Blog #3 contextual research

Timelines

This shows the intersection of history, chronology, and geography.

In the process of compiling information for our timeline on Esther Latrobe’s life, I have noticed that there are various modes of representation we could use. There are so many unique ways in which ideas can be represented visually, including diagrams, timelines, charts, and other pictorial methods. I agree with Grafton’s point, “graphic representation is among our most important tools for organizing information.” (Grafton 10) Two modes of representation in particular, chronology and geography, have clarified historical events by providing the time and place of these occurrences. Chronology provides structure and organization to all of these events by providing specific times. Geography on the other hand pinpoints the location of events so you can see what is happening on a global scale. While chronology and geography provide important information about history, it does obscure certain aspects of these events. For example, these two modes of representation don’t illustrate cause and effect and don’t dive into the details of history. They don’t analyze why certain things happened or how they occurred either. No, a line doesn’t tell us a full story, but it definitely does help with chronology; “from the most ancient images to the most modern, the line serves as a central figure in the representation of time.” (Grafton 14)

The timeline on the bottom portion of the image shows time represented in a linear fashion.

While I don’t believe a line can tell a comprehensive story, lines can be manipulated and shaped to try and represent more than just linear information. Changing length, color, or boldness of a line could all be indicators of something different in a visual representation of a historical event. It is difficult for a line to tell a story because “historical narrative is not linear. It moves backward and forward making comparisons and contrasts, and branches irregularly following plots and subplots.” (Grafton 20)


[iframe src=’https://cdn.knightlab.com/libs/timeline3/latest/embed/index.html?source=1HEAoVGg_5j-psdjOKOBoOWKUpRTtp3x9L9dA8a5qASE&font=Default&lang=en&initial_zoom=2&height=650′ width=’100%’ height=’650′ webkitallowfullscreen mozallowfullscreen allowfullscreen frameborder=’0′></iframe]