Categories
final blog

Final Blog

Throughout Humanities Now!, we utilized several tools to become more familiar with our memoirs. My group (Sam Salazar, Brendan Matthys, and Olivia Smith) approached our website with a central goal in mind: to create a home that displayed the results of the programs we used to analyze our memoirs and centralize everything around our research question. Going into the final project, the creation of the website, I was nervous, but with the help of my group and the streamlined design of WordPress, everything went well.

In order to incorporate our research question-Was the congregation perceived in a positive or negative way in the lives of Moravian People according to our memoir? If so, how does it play into their lives?- and truly centralize our website around it, we put it on our homepage. When looking at our

website, I think of a tree of knowledge with the research question along with a short abstract as the base and each tab a branch, each stretching out the base’s central question/idea. With this design, the reader is able to navigate back to the home page from any tab if they need reminded of our research question.


The first tab of our website introduces us, the transcribers, to the reader. I think this is one

of the most interesting parts of the website because not only do the descriptions give the reader a sense of our backgrounds and interests but they also show that really anyone can do this work. Each of the people in my group, including me, have different interests and experience, and this tab shows that diversity, which I feel is very important to understanding the way we chose to approach our memoirs and how we worked together to produce the website.

Our Timeline

Another one of my favorite parts of this website is how fun and easily navigable it is. We present our memoirs the same way they were presented to us in each process we went through, bringing the reader along the journey we went through before creating this website. Some parts, such as the Timeline and StorymapJS portions, are interactive, which allows the reader to  better understand the memoirs just as we did from each process we went through. As Grafton states, “We get them, our students get them, [timelines] translate wonderfully from weighty analytic history books to thrilling narrative ones” (Grafton, 10). These parts of our project make our work easier to follow and more interesting to not only humanities scholars but also to  those who are just exploring.


Another important part of our work with our memoirs was Voyant. Voyant allowed each of us to develop a better understanding of our memoir. Using this program, we were able to analyze word usage and the relationship between those words through visualization tools. Our website dis

Cirrus Visualization Tool

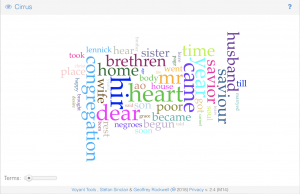
plays some of these visuals, allowing the reader to experience our memoirs the same way we did. The cirrus tool creates a word cloud of our memoir, showing the importance of words through the frequency of their occurrence in each memoir. TermsBerry displays the relationships between words by displaying how they are connected to one another. The textual arc creates a flowing arc between each prevalent word as they occur throughout the memoir. Links analyzes the adjacencies between words in the text, and essentially links them together. These visualization tools play a vital role in developing a better understanding of these memoirs; they present data from the memoirs in ways that aren’t possible without a digital humanities approach. As stated by Whitley, “The virtue of information visualization is that it can make complex data sets more accessible than they otherwise might be” (Whitley, 188).


Google Fusion Tables

Google Fusion was another important portion of our semester-long journey with our memoirs. Google Fusion is program that allowed us to understand the relationship between the TEI Tags we created in our memoirs in Oxygen XML Editor. Because emotion/health and placeName were the most frequently occurring tags across all of our memoirs, we decided to use Google Fusion to examine the relationship between the two. By doing this, we were able to better understand the emotional attachments to different places through visual tools that Google Fusion provided, such as fusion tables and networks. They also showed how important certain places were in the lives of the people of our memoirs. For instance, the fusion tables from Google Fusion made me realize that Benigna Briand experienced several emotions, both good and bad, in the city of Bath, showing me just how much of an impact this city had on her life. The tag frequencies we analyzed can be found under the “Tag Frequency” tab. In their writings , Drucker emphasizes the rich history and importance of visual tools, such as tables and networks, stating, “Almost all of the formats used in visualizations or information graphics venerable histories… The roots of tables and chart, calendars and timelines, maps and diagrammatic forms are old as writing and record-keeping.” (Drucker, 65).

Moravian Music Playlist

Probably the most fun part of our website can be found under the “Moravian Music” tab. We found a playlist when exploring Spotify titled “Moravian Music” and thought it would be a super cool addition to the website. Through this tab, readers can better understand another portion of the Moravians’ lives, allowing them to listen to what they would be listening to!


I really enjoyed the putting together the website and all of the processes I went through with not only my memoirs but also with my group throughout this semester. Digital Humanities is a very important and emerging discipline that I’m proud to have been a part of. As Peter Burjan, Dean of the Humanities at Duke University, explains quite well, “We have people who can pursue new ways of thinking (digital humanities) and do that and have interesting results. Why is that a bad thing?”

p.s. Thank you so much for a great semester and introducing me to transcribing, something that I’ve developed a great interest in!


Website: http://bethlehemhumn100.blogs.bucknell.edu


Categories
Blog #5

Blog #5

The process of mapping events from my memoir showed me just how important the visualization of geographical locations really is in understanding the text. My StoryMap helped me become more familiar with not only the text in my memoirs but also with the person the text was about: Benigna Briand. Mapping this memoir, I saw Benigna’s story come to life. As Bodenhamer wrote, my memoir served as a “mediator between us and the world it represents, and the two were brought together when mapped (Bodenhamer 25). Mapping brings you to this next level of understanding, especially in the content I transcribed, because it makes you familiar with the places mentioned in the memoir. Because all of my memoir took place in England, I had no sense of the geographical relativity of the places mentioned.

As stated by Bodenhamer, an artifact, such as a memoir, anchored in space (geographical/ mapping), creates a unique view and dynamic memory (Bodenhamer 27 & 28). Likewise, putting this artifact, or Briand’s memoir, into space through a StoryMap brings on a whole new and unique perspective. Bodenhamer also points out that deep mapping immerses the user into a virtual world of emotions based on the information mapped/ known (Bodenhamer 28). When mapping my memoir, I became enthralled in the world that was created. It was like I was there for specific events in Benigna Briand’s life. Mapping also made me realize certain geographical attributes from my memoir and the high importance of specific events. For instance, I knew that Benigna Briand was baptized in a lake, What I didn’t know was how far this lake was from Benigna’s home. The journey to this lake to get baptized had to have taken place over several days, and mapping this event showed me just how important it must’ve been in Benigna’s life to travel such a great distance. Also, I knew that Benigna traveled from Bath to Bristol every Sunday for 6 years in order to attend religious ceremonies, braving any poor weather or dangers that were on the way. Until mapping this event, I didn’t realize how far Bristol is from Bath, showing me just how dedicated Benigna was to the Moravian Society.

When creating a story to map, I decided to include all important events in the life of Benigna Briand, regardless of their geogrpahical location. Even if two consecutive events occurred in the same location, I mapped it. I did this because I wanted my map to not only show the many places travelled in my memoir but also the places in which several events took place. The impact that this has on the story as a whole, in my opinion, is large; mapping in this way also shows the importance of certain locations  to the life of the person that is being mapped. For instance, in my story there are several events that take place in Lyneham of Wiltshire because that is where Benigna spent most of her early life, making it a very significant location. This is also seen in Bath, the city in which Benigna and her husband settled down and started a family and Benigna ulitmately passed away.

[iframe src=”https://uploads.knightlab.com/storymapjs/8fff9ff31fd20510f3940093127b8ecd/bethlehem-benigna-briand/index.html” frameborder=”0″ width=”100%” height=”800″></iframe]


Categories
Blog #4

Blog #4

Throughout the duration of my work with my memoirs, I have developed a deeper understanding and appreciation of digital humanities. I also became very familiar with my memoir throughout each process that I went through, whether it be transcribing, tagging, or converting my transcription into an html text. Through these processes, I was also able to get a more in depth understanding of the way the digital humanity community works and realized just how complex this work can be.

My understanding and familiarity developed throughout the time that I worked with my memoir; I learned more and more each time I examined the text. At first, during my transcription, I would say that I developed a basic understanding of my memoirs; when I transcribe I am more objective towards the transcription itself, not the analyzation of the text. After transcribing the text, my understanding deepened as I read over my transcription, making sure that it was coherent. I became interested in the words that I had no familiarity with and proceeded to research them. For example, when I came across “Gnadenfrei,” I didn’t know if it was a person, place, or event, but after researching the word I became familiar with the city. The next stage, developing my timeline with my group, brought on an even more involved/developed familiarity and understanding of not only my text but also of the memoirs that my partners worked on; when we worked together outside of class, we shared interesting topics and events that were throughout our memoirs. Being able to link events in my memoirs to contextual events was enlightening; it provided more of  a background into the lives of the original authors of my texts. Finally, when it came to marking up and tagging my transcriptions, I learned even more about my memoirs. I can most logically contribute this deeper understanding to the fact that tagging invites you to analyze each and every word in the text on a deeper level to then be able to categorize its properties and overall impact on the text overall. For instance, the sentence, “till he at last with Howling & bawling went to Eternity,” from my Benigna Briand memoir seemed to have greater meaning and impact when I tagged it to eventually be, “till he at last with <name type=”emotion”>Howling &amp; bawling</name> went to Eternity,” causing me to be even more drawn to the emotion that really  bring great meaning and have a great impact on the sentence. This impact that words and their functions can have on the text when analyzed is conveyed by Pierazzo when she states, “While some of these parameters correspond to graphic evidence on the writing surface (letter shapes, ligatures, graphic components), others represent meta-information, such as dimensions, or qualifications of words in terms of both semantics and grammatical functions.” (Pierazzo 468)

One of the most important parts and greatest learning experiences of my work with my memoirs was the collaboration that took place with my group. Working with a group provided great insight into how the digital humanities community functions; it is very rare that a person works alone within the community. From providing us with editorial freedom to allowing us to work out our problems within our group, the structure of the entire assignment was very beneficial to learning and developing my understanding of DH. As Pierazzo suggests, in digital humanities, because we have so many resources at our fingertips, we must establish how much is enough/too much (Pierazzo 463). It was mostly in tagging where we had to establish this. In my group, we had to make several editorial decisions, which were made unanimously and without disagreement or arguing. Some of the decisions we made together was to tag God and any reference to him as “persName” and any religion/religious group as “orgName.”

Working with these texts is a huge responsibility; the editor’s interpretation of the text is huge factor in how the text is represented and presented. As stated in Pierazzo’s work and cited from Meulen and Tanselle, “the transcriber’s goal is to make an informed decision about what is actually inscribed at each point.”(Pierazzo 465) I believe that through each process our project went through, I, as a transcriber, was able to make well-informed decisions as I became more and more familiar with my memoirs and my understanding of them developed and deepened.


Categories
Blog #3 contextual research

Blog #2: Timelines

Image result for chronology
Chronology Pattern


The method utilized to represent historical data is just as important as the the information it contains. Modes of representation can determine the clarity of the information being shared and are examples of  interesting ways to analyze information. Chronology and Geography, two modes brought up by Grafton, show us the pros and cons of using certain modes of representation to present historical data/events.

Image result for geography
            The Layers of Geographical Representation

During the creation of the Timeline.js project and reading of Grafton’s work, I got to experience and learn how information and the mode of how it is represented have a close and dependent relationship. In Cartographies of Time, Grafton shows how modes of representation have progressed throughout history, highlighting the improvements and background that led to timelines. Historical data can benefit or suffer from its compilation into a timeline or its representation on a map. I definitely witnessed the benefit of each mode on the events that I pulled from my transcriptions. All timelines, the medium of chronology represented in this project, are unique and have different forms of organization. My timeline utilized contextual events in relation to the historical events in my transcription and then presented a visual in order to better support each event. The main benefit of this method is its organizational value that creates a better understanding of the historical events, both literally and contextually, for the reader. This method also makes the presentation of the data more interesting with its visuals and contextual events. Another interesting aspect of this timeline is how it has the capability of utilizing maps, a popular medium of geography, in its visuals. The main con of utilizing chronology to present historical data that I saw in this project is that the “story” can become compromised in the process of collecting the data to compile into a timeline. For instance, when scouring the transcriptions, we automatically pull the events that come with a date; in order to chronologically organize data, we feel the need for numbers. Because of our reliance upon the time, days, months, and/or years that structure the line, we sometimes fail to dive deeper into the events represented, sacrificing the “story.” Grafton points this out in his work, stating, “Our idea of time is so wrapped up in the metaphor of the line that taking them apart seem virtually impossible.” In this process, many key events in the transcription are not pulled simply because they were not attached to a specific time, day, month, or year and, in turn, are not represented and shown to the reader. Even if these events are included and compiled into the timeline, there is a compromise in accuracy; the author must then generalize the time in which the event took place. With geographical representation, events and data can also be compromised. Similarly to how events without time, day, month, or year cannot be included in timelines without being compromised, events not marked by a location cannot be geographically represented without being compromised.

After the completion of my timeline, I came to the conclusion that the modes of representation identified by Grafton are very beneficial when used to present certain data. In addition, I noticed how these modes of representation can be detrimental when used to present other data. My findings evoke the debate of whether or not the purpose of these modes is to tell a story or simply organize data. In my opinion, they do both. These modes organize the data/events in a way that we can formulate a story. As Grafton points out in his work, the author must first look past the linear when creating the timeline, and the reader must do the same if we are to utilize all of the benefits that come with timelines.  The lines of a timeline are the lives of the story; when they end, the story ends. And the visualization of the locations of the events provided by the use of geography as a mode can make sense of the data and further support the story.

LINK TO TIMELINE: https://docs.google.com/spreadsheets/d/19D5MbZfE71t0zlKwUYbnZyNQD3EcQef-JETzGkvr17k/edit?usp=sharing

               Timeline visual: Mode of Geography
          Timeline Visual: 18th Century Marriage