Categories
Uncategorized

Final Blog

For my final blog of the semester and class, I will be discussing the process of our final project. Our final project is a website on WordPress and it explains our complete process of transcribing the memoir of Elizabeth Grundy. We explained all of the tools we used to complete it, and how it answered our research question, “Were there different relationships between allegiance to family and allegiance to the church in Moravian lives?”. My group, Mitch, Meg, Caleb, and I worked extremely hard in order to answer this question, and I think we did a good job at it, with the help of all of the tools listed below.

The tools we used throughout our project were Moravian Lives, Oxygen, TEI File, WordPress, Voyant, Google Fusion, and Story Map.
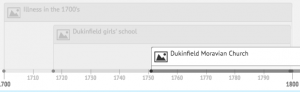
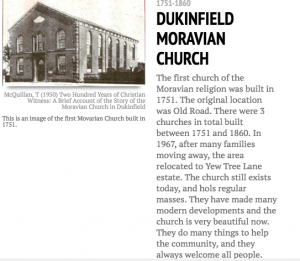
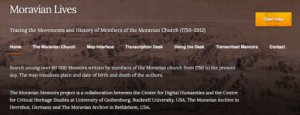
Moravian Lives was the first site we worked with, as this was our transcription desk. This is where the original memoir was and we had to translate it word for word. It was very difficult at first because it was written in cursive, very unclear. We had to look very closely at it and ask our group members for advice on specific words. Eventually, we got the hang of it noticing that the different parts of our memoirs had similar abbreviations that were hard to encrypt.


The next tool we used was Oxygen. This was the way we tagged the different words and phrases in the memoir. We tagged place names, role names, person names, objects, events, health, and emotion. During this process, we had to search through the whole memoir finding words that matched these tags. We tagged as many as we could to make the process in the future easier to do, comparing tags.

TEI Files were the next thing we used during our process. This included the tagged memoir we made in oxygen, and then each group member was given a file to put their tagged memoir in.

WordPress was the tool we used to put our final website in. It was a useful tool to show our work in a great way. It was a bit confusing learning how to first use it, we struggled to add and delete menus and post certain things, but it ended up working out well. Voyant was the next tool we used and that had very many aspects to it. It’s different components allowed us to learn a lot more about Elizabeth Grundy and her life.

SteamGraph was one of the aspects of Voyant and it showed us the key terms. It was a graph that determined the usage of the key terms and how they changed, throughout a passage. It graphed the 5 most frequently used words and had a horizontal line showing this. The lines were color-coded and they changed, going up and down, while the passage went on, showing how the frequency of that word changed. The more the word was used, the higher the bump was on the graph. For example, in the image below, you can see that at times the word, Jesus, is the highest bump, but at other times, the word, son is.

Another tool that is apart of Voyant, is Trends. This is similar to Trends where it graphs the key term. It graphed the relative frequencies of the key term verse the document segments. It had bumps in the graph as well, but there were points for each keyword, and when you hovered over the dot, it gave you the exact frequency of it. The dots were connected by lines creating the graph.
Graphs help readers understand data much easier than just reading something. In Matthew Jockers writing, Macroanalysis: Digital Methods and Literary History, he includes many graphs such as ours, and it helps to show a better understanding of the material.

Another tool we used was Word Tree. This one was definitely my favorite. It created a “tree” with “branches” surrounding it. The keyword was placed in the center, and words that came before and words that followed the keyword were shown in the tree. After viewing the branches of the chosen keyword, you could then click on a surrounding word and view that word’s branches. This tool gave us an interesting view of the memoir and showed us how certain words connected. It showed us how before the word Savior, there was Dear, showing her positive relationship with her God.

The last tool we used was Google Fusion. This tool compared tags, the ones that we found while using Oxygen. Each group member compared two different tags, such as object and emotion. Once they were chosen, we exported a chart we made relating the two tags and put them into Google Fusion. It then provided us with cards, maps, and graphs similar to the word tree. They showed differences and similarities to the tags. In the image below, this showed the relationship similarities between the different words used in the memoir.

All of these tools were able to create the story of Elizabeth Grundy’s life for the viewers, without them even reading the whole memoir. As Johanna Drucker wrote in Graphesis: Visual Forms of Knowledge Production, “Human beings read sequences of images and make sense of them” (Drucker 4). People can easily view images and know the story. This is what these tools allowed for the readers.

Honestly, when I came to class the first day, I was very surprised at what this class was actually about, I did not think we would be transcribing, or using all of these different tools, but I was pleasantly surprised. I am impressed in how much of this information I remembered.  I did not expect to be able to do all of the things I learned, and I think it will help me very much in the future. Not everything came easy and I had to struggle through it but I am glad I took this class. It was very interesting and I learned a lot.

Here is the link to our wesbite:

http://grundyhumn100.blogs.bucknell.edu/


Categories
Blog #5

Blog Post #5

Over the past two weeks or so, my group and I put together a map of Northern England.  Our memoir was written by Elizabeth Grundy, and she discussed very important life events in her memoir that we thought needed to include.  The cities in our map are specific places that Grundy mentioned when these events occurred. Events included her sons birth, death, her own death, and when she moved to a different place.  Bodenhamer writes, “The spaces of interest to the humanities also could be personal-emotional space or the body in space-and even metaphorical or fictional…” (21). These events in Grundy’s life were so intense, I believe they could be considered a ‘personal-emotional space’, as Bodenhamer mentions.  Knowing these specific areas where she was, allows us to understand what she was experiencing throughout her journey, and knowing how far she had to travel, and what the areas she was were like. Using StoryMap JS specifically shows the distances between the places, and shows us the exact different spots in the country on the whole map.  We can zoom in out when we would like and see the broader vision if we would like. There were very tough things that happened to Elizabeth Grundy, and knowing how these all went down allow us to feel more connected to her. I really enjoyed making this map, and seeing the finished product was really great. Something that stood out to me in Bodenhamer’s writing was, “Spaces are not simply the setting for historical action but are a significant product and determinant of change” (16).  This connects to Elizabeth Grundy’s memoir, and the map I made, very well because of how it explains the importance of a space. It isn’t just a point on the map, but an event. Compared to the maps we found from the times of Grundy, they have come a long way in advancing them. The maps in the 19th century were hard to read and did not always include every place. There was nothing compared to StoryMap JS in those times, and it is amazing how fast technology changes and how dramatically.  Mentioned in Bodenhamer’s writing, there are so many new ways to explore maps these days. You can become apart of the map, and see everything that is in it. It is amazing how these things are possible, but I think this is such a great thing for discovering different places in the future.

https://uploads.knightlab.com/storymapjs/e9b9ba38a235ad1c530afdab9e1d6ba1/grundy/index.html

[iframe src=”https://uploads.knightlab.com/storymapjs/e9b9ba38a235ad1c530afdab9e1d6ba1/grundy/index.html” frameborder=”0″ width=”100%” height=”800″][/iframe]

Categories
Blog #4

Blog #4

The past couple of weeks, my group and I have been doing a lot to try and transcribe the memoir of Elizabeth Grundy.  I am in a group of four and we each were assigned to 6 pages each.  It was very challenging being able to read the tough cursive. Having to read it so many times, I realized how tough Elizabeth Grundy’s life was.  She went through very much struggle and had to react in different circumstances. She also looked to God very much, asking for his help. Each group member was assigned a certain amount of pages of the memoir, so that aspect was individual, but we eventually needed to come together to create the timelines and when we started tagging everything.  We had to discuss and decide which words were tagged to which specific thing. One debate we had was whether Jesus, Savior, and Christ were going to be marked as “Persname” or “Rolename”. This was important because people have different beliefs, and we all needed to agree on the tag. We decided on “Rolename” so then we had to make sure everyone tagged those.  Another thing that we had trouble with was deciding what was considered “objects” and what we’re not. I originally did not know if every noun or thing was an object. We decided on only specific words being objects.  It took a while to tag each emotion and to decide the words.  Here is an example of the decision to tag God as roleName instead of persName.  It was an important decision to choose this and it worked out well for our group.

In the reading “A Rationale of Digital Documentary Editions” by Elena Pierazzo, the author states how she believes that a transcription is a form of translation.  Each transcription is translated differently so each author creates different transcriptions. There are many different features included in the process that help the transcription.  The author chooses their specific interpretation and they chose what to represent each and it changes based on the author’s vision. There are purposes of editors, which are similar to what we do with tagging.  We also edit by making sure the words match the same as the original document.

Here is an example of the different tags for each emotion.  It took a lot to find each and to physically tag each word.

Categories
Blog #3 contextual research

Blog #3

Creating these timelines these last couple of classes has made me think about how important they are to history.  Without certain timelines with specific historical events, many things in history would be different, and for all we know, they could not exist.  Chronology on these timelines is the most important part. Without a specific order of when each thing happened, it is almost pointless to have timelines, because they need to be accurate in order to create resourceful information.  Chronology has been used for a very long time. In Grafton’s Introduction, he writes, “They began to plot events not just against long series of years, but against lunar and solar eclipses that could be dated precisely to the day and the hour” (17).  Historians and astronomers would use chronology in order to plot accurate points for things they would study. Many timelines are usually in a line, but I honestly do not think they need to be in a specific image, as long as the events are in the right order, then they will be able to be read correctly, and read the story.

So many extremely important events from history occurred because and were turned into timelines.  In Grafton’s introduction, they mentioned the Chart of Biography by Joseph Priestly. This is something that is still mentioned today because of timelines.  Another thing today that has many timelines are museums. In one of the images in Grafton’s introduction, there is an image from the Museum of Natural History in New York City, and it included a timeline.

The timelines that my group created in class include similar things to all of the timelines mentioned above.  The image below shows the separation of each event, and shows which event occurred first, and the order that followed.  This allows the viewers to know when everything occurred.


This image is of a specific event that occurred during the time of our memoir, and we were able to include an image that helped our timeline tell the best story.  It also tells the years during when this occurred.