The process of transcribing and analyzing Esther Latrobe’s memoir was an informative experience thanks to the use of various online tools like Transcription Desk, Oxygen Editor, Voyant Tools, Story Map JS, and others. The memoir provided a personal narrative (although some parts are third person) from a prominent figure in the 19th century Moravian community in Europe. Given a look inside Esther Latrobe’s life, my group was able to create a research question based on reading her memoir. We decided to answer the question: How did Esther Latrobe’s relationship with God affect her lifestyle, and help her recover from such illnesses and hardships? To accurately answer our question, we had to use various digital tools to synthesize and analyze her archival material as data which we later published in a digital medium as a website. The tools are explained on the website to recognize the important forms of digital engagement they provide because they encourage close and distant reading, temporal and spatial visual analysis, and a way to appropriately organize information to effectively inform and educate the public.
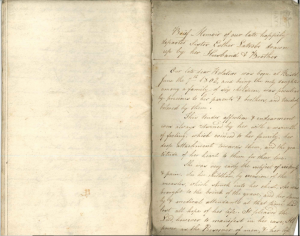
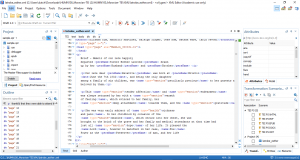
When my group was assigned Esther Latrobe’s memoir to transcribe on Transcription Desk, we divided the pages among ourselves and had to closely read our assigned sections to transcribe the documents onto the digital platform. Because the transcription process required us to read the photographed copies of the memoir word by word, we had to accurately transcribe each letter without making mistakes. However, we ran into some complications such as not being able to read certain words due to our unfamiliarity with British 19th century handwriting and blurry documents. After communicating with Professor Faull about the blurry pictures, she was able to request her colleague, Lorraine Parsons who is a librarian and archivist at Church House in London, England, to send better quality copies. Here below on the left is a screenshot of the editor’s view on Transcription Desk of a blurry page one and the image on the right is the clear version Lorraine Parsons kindly sent.
![]()
The transcription process is extremely important and crucial in analyzing the data to answer our research question because the transcription is “ a derivative document that holds a relationship with the transcribed document” which is the physical memoir (Pierazzo). The process of transcribing the archival documents enables a much larger audience to have access to the otherwise exclusive memoir. Thanks to the digital platform, Transcription Desk, we as editors were able to make the documents accessible as accurate copies of the original memoir and also preserve the authenticity of the original documents since the platform displays the original handwriting style on the left side of the screen.
Because we transcribed Latrobe’s memoir, we were now able to analyze the digital data with online tools to publish a digital edition and answer our research question because the ways events are recorded “represent a form closely calibrated to both the interests and the vision of their users” (Grafton). The memoir is necessary to make accessible because it informs the reader of not only the events but the context for how people like Esther Latrobe thought in that time period. The transcription would eventually lead to the creation of a digital edition which is the “formal (public) presentation of such a derivative document” (Pierazzo). However, before publishing the digital edition, we used various tools to analyze the data to answer our research question.
In the initial analysis, we used Oxygen XML Editor 20.1 as a tool to tag keywords such as names, places, and objects to identify overall themes and patterns in the memoir. Thanks to this platform, we were able to see that in terms of people, there were many proper nouns referring to God which highlighted the significance religion had in Latrobe’s personal life. However, it was difficult deciding as a group what would count as those religious keywords because some would be singular words like God or Saviour and others would be phrases like Lamb of God or Son of God. In the end, we decided to tag entire phrases if they were capitalized like the singular pronouns. It is important to recognize that editors “must have limits, and limits represent the boundaries within which the hermeneutic process can develop” (Pierazzo). It is not possible to be completely objective when it comes to editing because there are too many exceptions or unique cases to set universal standards or definitions when making editing decisions. Thus under our specific group’s definitions of people, we saw a correlation between God and her emotions as well as places. This is assumed to be the case because she described multiple times in her memoir that she felt it was a part of God’s plan for her to move from place to place and thus felt a variety of emotions in response.
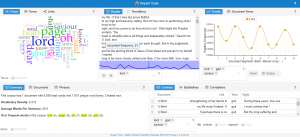
We also used Voyant Tools to look at the word frequency to pinpoint keywords since it is logical to assume that the more important a word is, the more frequently it is written. The Cirrus tool creates a word cloud, the Summary tool shows the frequency count for the most repeated words, the Reader tool shows where exactly the repeated words show up, the Trends tool presents a line graph of the frequency patterns, and the Contexts tool shows the words in the same sentence as the common words to provide greater context. All these tools showed how words like Lord, God and Saviour had been repeatedly written the most, proving how much influence Latrobe’s faith had in her life. This resembles what the founder of the Moravian Church, Gregory the Patriarch, said about “Moravians as ‘people who have decided once and for all to be guided only by the gospel and example of our Lord Jesus Christ…’” (“A Brief History…”). It was normal in the Moravian community to devote one’s entire life to the religion.
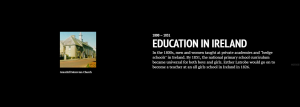
Timelines give both text and images to show chronology and geography which teach the reader when and where events happened and what they looked like. For example, in the Latrobe timeline, there are slides about education and sanitation practices that explain the cultural context for the 1800’s in Europe where Esther Latrobe wrote her memoirs. The religious presence in Europe, “Anglican, Protestant and Orthodox – have been involved in the ecumenical movement from the beginning” (Member Churches).

Timelines not only record chronological events but also tell stories through the text and images of each event because “while history dealt in stories, chronology dealt in facts” (Grafton). It is chronology that is credible and shapes historical stories.
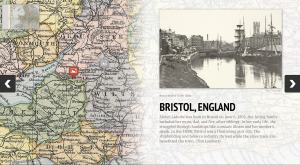
Story Map JS was another tool we used to look at the locations Latrobe mentioned in her memoir to put Esther’s life into context. Gathering geo-spatial data is a useful method for analyzing the memoir because it provides geographical context and a visualization of her recorded physical movement from place to place. Maps in general provide a frame of reference for the audience to understand the context of where and how people meet and form relationships. Given that she lived in the 19th century before cars were invented, it is rational to assume her main mode of transportation was by foot, horse, or boat. However, she does not mention how she specifically moved from place to place nor the amount of time it took her but Latrobe did not move too far away from her hometown, Bristol, when she moved to Tytherton at a relatively early age, most likely by foot. As she grew older and more independent, she moved further away to Gracehill, Ireland for a job as a teacher at the Ladies Boarding School which she thought was God’s sign. The map shows there is an ocean between England and Ireland so the audience can make an educated guess that she traveled by boat which requires more independence than traveling by foot because it is a bigger time commitment and traveling by boat is relatively more dangerous than by foot. She then had to travel again by boat from Gracehill, Ireland to Ayr, Scotland but with her newly wed husband to start a new chapter in her life. Her movements from place to place shows to some extent the progression of her life and her maturity as she accepts bigger and bolder changes such as studying away from home, accepting a job offer, and marrying her husband. Bodenhamer comments on the idea of change, saying, “Spaces are not simply the setting for historical action but are a significant product and determinant of change” (Bodenhamer). The story map helps the audience visualize the stages of Esther Latrobe’s life, providing a “view of history and culture through the dynamic representation of memory and place… fusing qualitative and quantitative data within real and conceptual space” ( Bodenhamer).
The final presentation of our group’s analytical process is a website which includes all the tools we have used to answer our research question. It shows how we used each platform to analyze the data in an online environment.
http://latrobehumn100.blogs.bucknell.edu/sources-2/
Works Cited
“A Brief History of the Moravian Church.” Moravian Church of North America.
Bodenhamer, David J. “The Potential of Spatial Humanities.” The Spatial Humanities: GIS and the Future of Humanities Scholarship. Indiana U P, Bloomington & Indianapolis, IN. 2010. 14-30.
Grafton, Anthony and Daniel Rosenberg, Cartographies of Time (Princeton: Princeton UP, 2009)
Member Churches- Europe. World Council of Churches, 3 Jan. 2014.
Pierazzo, Elena, “A Rationale of Digital Documentary Editions” in Literary and Linguistic Computing, Vol. 26, No. 4, 2011. 463-477.