The final project, in my opinion, serves as a culmination of everything we have learned and applied thus far in The Humanities Now!. Through the duration of this course, we have learned about the varies methodologies of the digital humanities, and how many different ways words in a text can be analyzed.
I believe the website is super useful in that every tool we have used to analyze the memoirs can be represented on there through the use of iFrame html code. Through the creation of separate pages for each tool, I was able to show many different aspects of each memoir we had. The ultimate goal of the website was to answer our research question.
The home page first introduces our research question, “Was the congregation perceived in a positive or negative way in the lives of Moravian People according to our memoir? If so, how does it play into their lives?”. This is the first thing people see on our website, and it is the question we are using all of our technological tools to analyze. Right after the research question, we listed all of the various technologies used, as to accredit them. I also included a picture from my Anna Elizabeth Rauch memoir as to show an example of a typical page we had to each transcribe.
The first tab on my website isn’t a tool at all, it’s an “About the Transcribers” tab. I felt that the first priority in this project was to give credit to those who deserve it, so I put biographies of my teammates as the first tab.
The next tab was my “List of Memoirs” tab. For this tab, we decided to include the memoirs for each person. The applications Oxygen and Github Desktop proved to be really useful for this part of the project. With the help of Mrs. Jakacki, I was able to conver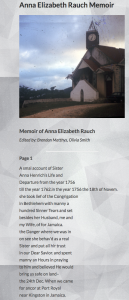 t our individual memoirs from text into an HTML format, which means that it is viewable on the website. I also found a picture of a Moravian settlement and HTML coded it in to precede each memoir, as if to establish an initial setting.
The next tab is “Tag Frequencies”. This tab utilizes the applications “Google Fusion” and “Oxygen”. I provided a link for each memoir protagonist that leads right to a Google Fusion sheet. On this sheet are the entities broken down for each memoir. This was chosen because we needed to dive into the individual word usage more than the memoir as a whole. If we want to really delve into the research question, we need to look deep between the lines of the memoir The application Oxygen was useful in that we were able to TEI tag each memoir. This means that every name, date, place, emotion, or health status was tagged with an HTML tag, and then those various tags were exported to a .CSV file. With this .CSV file, Google Fusion was able to analyze various aspects of our entities, including 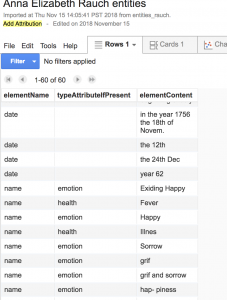 creating a network between the different tags, and creating a map of memoir locations.
The next tab is “Timeline”. I believe a TimeLine is important in that it can chronologically show the memoirs , which is essential to our research question. For this task, we used the online application TimeLineJS, which involved using google sheets as well. Since our group had a few different memoirs, we had a conglomerate timeline that overlapped the events for each protagonist. I found it interesting to see the events that happened simultaneously with the protagonists, even though they happened thousands of miles apart. One struggle we found was in the initial interface of the timeline, as it was not able to initially combine all of our people into one Timeline. After a few hours of technological struggle, we figured it out. I can also attest that secondary sources were helpful for making my part of the 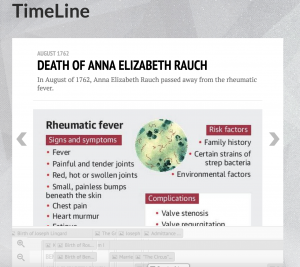 timeline contextually correct, as there is not much setting given within the memoir. The first website I used was a project by a volunteer curator named Margaret. She wrote about the Mesopotamia Plantation in Westmoreland, Jamaica, and how the Barham family ruled oppressively over the plantation. The TimeLineJS actually had an exportable HTML format that I was able to integrate into our website. I think this is an essential part of the website.
The tab after is the StoryMapJS tab. StoryMap JS was my personal favorite tool to use for analyzing because it provides a spatial context for the memoirs. I believe Bodenhamer explained it best in his paper, when he said, “[Mapping] promises an alternate view of history and culture through dynamic representation of memory and place, a view that is visual and experiential, fusing qualitative and quantitative data within real and conceptual space” (Bodenhamer, 29). Telling the spatial story of each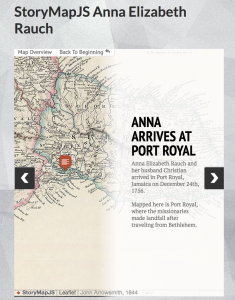 memoir was essential to answering the research question in that the lengths the protagonists went to fulfill their Moravian duties conveys their undying commitment to the congregation. I didn’t quite have the full story on Anna Elizabeth Rauch coming into this, but Professor Faull supplied me with the only book I could find on Mesopotamia, “A Tale of Two Plantations.” This book actually mentioned Rauch specifically, as well as her goals and ambitions in Jamaica. I was able to put this on our website because each StoryMapJS had an embed code that used iFrame, which is compatible with WordPress.
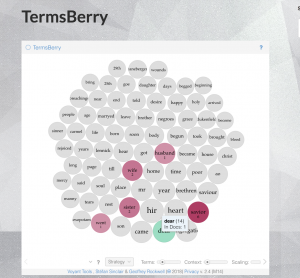
The following tab is “Voyant.” Voyant is an online application that takes an input of a text file, and analyzes different aspects of the file, such as the most prevalent word, or the most frequent adjacencies. This was chosen so that information visualization could take place. Whitley stated it best in his paper when he said, “The virtue of information visualization is that it can make complex data sets more accessible than they otherwise might be” (Whitley, 188). I enjoyed Voyant in that it had a multitude of options to analyze text such as Cirrus (Word Cloud based on word frequencies) or my personal favorite, the WordBerry (turns words into ‘berries’ that light up based on the occurrence of word adjacencies). For the website, I used Voyant on a text file that was conglomerate of all of our memoirs together in order to analyze the entirety of the Bethlehem Memoirs.
Next on the tab list is Documentation This was basically a page that gave a link to every software/application used and what purpose it served in our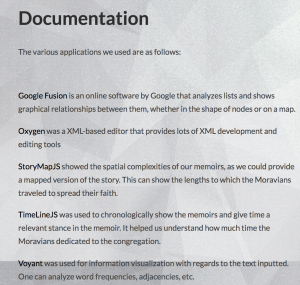 project. This page was important to include so it would be possible to replicate our exact methodology of analysis on another set of memoirs.
The next was more for fun than anything, but It’s labeled Moravian Music. I found a Spotify playlist that featured Moravian Music, so I embedded it into the website. It provides a neat musical take on the 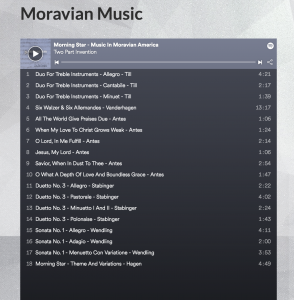 lives of the Moravians, and I found it to be pretty relevant to our subject matter.
The last tab we included was a Works Cited page, in which we cited all of the sources we used in class, and some secondary sources used for our memoirs.
Creating this website was a great experience, and I believe I have become more technologically fluent from this. I have also developed a passion for the humanities through this class. It has been a great year!
I am a sophomore at Bucknell University, majoring in Mathematical Economics and minoring in Computer Science.


