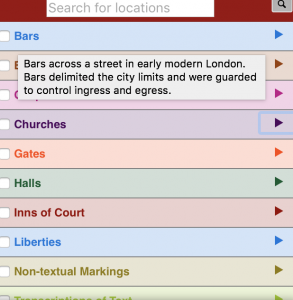
My first digital humanities approach I chose to look at is mapping, by observing the Map of Early Modern London (https://mapoflondon.uvic.ca/agas.htm) page created by many members, who were lead by Janelle Jenstad, Martin Holmes, and Mark Kaethler. This map is designed to streamline the information found in encyclopedia, library, and stow editions all into one place with an easy user interface. Primarily this map is an example of textual analysis, by bringing hundreds of texts together to provide the viewer a streamlined overview of each particular area, while also providing the information to dig deeper into their research should they choose. The map is also an example of visualization, while also preserving and analyzing the areas of historical London. This is a great way to do this because maps provide a much more clear representation of what London actually looked like than you would ever find in a typical textbook. This interface allows us to visualize great amount of historical information in an accessible way. Easy to use, this map allows me to zoom in on a location, click on it and provides vast information on that location. Additionally, you can sort by category and pull up any locations relating to that category with ease. This map revolutionizes the way users view maps and find certain things in London. Not only does it show me the location of each place, it provides historical context as well as hundreds of articles about each place. This is easily the best interface for viewing a map, as it is easy to search for or find new places, and provides more information on each place than possible to find anywhere else. Lastly, this map is able to include where each piece of information came from, making it easy to verify the authenticity of their information.
.

Another interesting website I viewed is titled Selfie City (http://selfiecity.net/#) coordinated by Dr. Lev Manovich, by there help of several contributors. This site provides image plots trying to categorize the commonalities of selfies in particular areas. This is a clear example of visualization, define by Johanna Drucker as “a methodological reversal which makes visualization a procedure rather than a product and integrates interpretation into digitalization in a concrete way” (Whitley reading). This site uses image analysis to relate themes between selfies, for example the tilt of photos, use of glasses, age, gender, etc. There is definitely no better way to find information regarding selfies by region than through their technology used that closely examines each image. One interesting stat found was that Sao Paulo females tilt there head on average 17 degrees in their selfies compared to Moscow males who average a 7 degree tilt. This is a very interesting stat that I would never have previously thought possible without the use of this technology. Their automated analysis of images allowed them to recognize just the smallest details that would’ve taken forever to browse through so many photos with just the human eye. When examining photos, this is truly a remarkable discovery that will revolutionize the way we study images.


Tyler George is a political science and history double major at Bucknell University in Lewisburg, Pennsylvania. Tyler formerly attended Lincoln-Sudbury high school, in his hometown, Sudbury, Massachusetts. Tyler plays club hockey at Bucknell, and also participates as an Army ROTC cadet in the Bison Battalion.